Wage Series Part 6: How Do Your Wages Stack Up: Statewide Commissioned City and County Wage Rankings

By Jim Cline and Kate Kremer

In part 6 of our ongoing wage series, we now turn to the rankings of County Deputy and City Police Officer rankings throughout the State. This series always produces both expected and unexpected information about the relative standing of jurisdictions.

[Read more…]

Wage Series Part 5: Economic Conditions

By Jim Cline and Kate Kremer

This is the fifth in our extensive series on current negotiation conditions and trends. In this article, we focus on recent economic developments.

[Read more…]

Wage Series Part 4: The Impact of COVID on Recent Wage Settlement Trends in Washington Public Safety Labor Contracts

By Jim Cline and Kate Kremer

This is the fourth part of our early 2021 wages series. In the last article in our 2021 wage series, we looked at all Washington public safety settlements from 2019 to 2021. That report showed a downward trend in 2021 settlements.

[Read more…]

Wage Series Part 3: Recent Wage Settlement Trends in Washington Public Safety Labor Contracts

By Jim Cline and Kate Kremer

This is the third part of our 2021 wage series. In this article, we take a look at recent contract settlements and examine how those trends vary from recent previous years. Our view of 2019 and 2020 settlements and what we have so far from 2021 indicates that the Washington State public sector wages dropped in 2021 but not as substantially as employers might suggest. We see some wage increases with little substantial “real wage” growth (as measured once controlled for inflation). Whether a growing economy eventually will accelerate these is something we’ll discuss later in this series. 

[Read more…]

Wage Series Part 2: Trends in CPI and its Impact on Your Contract Negotiations

By: Jim Cline and Kate Kremer

In part one of our early 2021 Wage series, we reported on the latest CPI data. That was a look backward at the more recent data. In this article, we look forward to what you might expect for inflation over the near term.  Given the goal of achieving a wage increase that at the very least doesn’t fall behind the cost of living, knowing where inflation may be heading is important.

[Read more…]

Wage Series Part 1: Latest CPI Reports

By: Jim Cline and Kate Kremer

Launch of the 2021 Winter Wage Series

This is the first of a multi-part series addressing current economic conditions and wage settlement trends.  In this Winter 2021 Wage Series, we’ll bring you an update on CPI and economic developments, wage settlements, interest arbitration trends, statewide wage rankings for public safety classifications across the State, and an in-depth analysis of what factors appear to be impacting those rankings and settlements.

[Read more…]

Moderate Insurance Rate Increases for 2021 In Tough Times

By Jim Cline

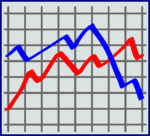
A year unlike any other, health care has been at the center of our attention. What does that mean for insurance costs going forward? Always an important part of the negotiated total compensation, we’re also paying attention to the trends in health care costs.

Our preliminary assessment of costs based on our review of several major plan offerings shows moderate increases for 2021 rates. Here’s a breakdown by major carrier and plan:

Not all these plans are of equivalent value. This table breaks out the rates by each of the tiers and the major plan specs.

The popular and often bargained for LEOFF Trust plan has seen several spikes in rates over the recent years that have made it less cost-competitive compared to AWC and PEBB plans. For 2021, the LEOFF rates are increasing only by 2.5% which reflects some apparent improvements in the Trust’s claims experience and utilization. After several years of relatively good performance, AWC rates are rising 4-5%.

We’re at the outset of collecting 2021 data statewide and will make that available as we collect and evaluate it. Overall, we had expected moderate 2021 rate increases based on industry utilization reports.  Despite the pandemic that is filling ICUs, overall health care utilization appears to be reduced this year.  People are deferring optional medical procedures and generally avoiding clinic visits.  More widespread use of telemedicine has reduced costs for 2020 and could result in some longer-term savings as well.

Visit our premium website for access to more benefit information.  For nonsubscribers, see the service description and subscription information at the end of this newsletter.

State Economic Forecast and Sales Tax Revenues Rebound

By Jim Cline

If you are in or soon entering bargaining, right now it is critical to tracking economic developments and also reviewing the month to month sales tax numbers, in a way that it has never been before. If you are in or soon to be in contract bargaining, expect that the budget and the general state of the economy will loom large as points of discussion.

The latest report from the State Economic and Revenue Forecast Council offers a moderate glimmer of hope that the economy is now heading in the right direction. It summarizes the current situation:

The Washington economy continues to recover from the recession but growth is slowing.  As of October, the state’s economy has recovered nearly half the jobs lost in March, April, and May but employment growth has slowed.  Washington’s unemployment rate declined to 6.0% in October, down significantly from the 16.3% rate reached in April.  Washington housing construction improved to 43,700 units in the third quarter from 40,300 units in the second quarter.  Washington exports continue to decline, mostly because of transportation equipment.  Washington GDP declined 7.7% from the peak compared to 10.1% for the U.S. Seattle consumer price inflation exceeded the national average in October.

In a previous issue, we discussed the dramatic drop in sales tax revenues during the first half of the year but that the drop was not nearly as sharp as many local budget officers have been projecting.  And even better news: The latest numbers going through Q3 (July-September) show a rebound in sales tax revenue.

But that rebound is not uniform and many jurisdictions still face steep revenue reductions. Where’s the variation and what’s driving it? Among taxing jurisdictions, it seems to be a case that the “rich” have been flattened and the “poor” have been lifted.  Jurisdictions that had generally limited commercial districts like counties and “bedroom community” cities have actually seen an increase. Most cities have seen a reduction in sales tax revenues and those with large malls and shopping districts have seen dramatic reductions.  Jurisdictions with big box stores like Costco that continue to be open have been able to tread water.

Among the beneficiaries of this dislocation, as indicated, are rural counties (e.g. Adams County) and bedroom cities (e.g. Normandy Park, Shoreline) that have limited commercial tax bases. Why? It’s called the “Amazon effect.” The reduction in in-person shopping has been at least partially offset by an increase in online shopping. That’s caused a redistribution of sales tax revenues. Point of delivery sales taxes means that there’s been a transfer of sales tax revenues to those jurisdictions historically less reliant on sales tax revenues.  Note that this is a limited time impact that will pad reserves but is likely to evaporate following a return to normal shopping patterns. It’s not a stream of revenue that can be relied upon.

Across the state, revenues are both up and down across jurisdictions but statewide they are flat for the most recent quarter. Following a steep Q2 decline, Statewide Q3 (versus Q3 2019) revenues are off only slightly — .35%. (The Q2 drop was 8%.)  A month to month review of Q3 shows some improvement over time with a reduction in July statewide numbers followed by an increase in August and September.

It’s also important to put this data into perspective as to the broader array of local government revenues.  Sales tax revenues are a major source of revenue for most cities, and many counties, but especially rural counties. Cities without a commercial hub, are typically much more dependent on Property Taxes and other revenues. While there have been some predictions of property tax declines, we are not expecting those revenues to be off much more impacted by a delay in a collection than an actual reduction.

We’ve already seen some wildly inaccurate budget office reports, so it’s important to do your own homework. To be fair, most budget officers are making projections in very uncertain times. Planning for 2021 budgets, which is well underway, is made tougher by the level of uncertainty over the direction of sales tax revenues.

We will continue to follow economic and sales tax trends through this year and into next on a more immediate month to month basis and will keep you informed on those changes. We’ll offer an upcoming discussion about how the economy and tax revenues fit into the broader set of issues you’ll face during negotiations.

More economic data is contained on the premium website.  For access to Premium Website information, see the description and subscription links at the bottom of this newsletter.

National CPI Drops, but Seattle Stays Higher than Expected

By Jim Cline and Kate Kremer

Despite the pandemic and the associated recession, inflation has not completely disappeared, especially in the Seattle metropolitan area. This chart shows the month to month changes in the Seattle and All Cities “W” index from October 2019 to October 2020:

[Read more…]

Sales Tax Revenues Decline, but not as Badly as Rumored

By: Jim Cine and Kate Kremer

If you are in or soon entering bargaining, right now it is critical to be reviewing the month to month sales tax numbers, in a way that is has never been seen before.

Two immediate takeaways: First, sales tax revenues have dramatically declined, and second, the drop is not nearly as sharp as many local budget officers have been projecting. You can’t take your budget department’s dramatic announcements of dire circumstances to be accurate without doing your own work.

[Read more…]