By: Jim Cline and Kate Kremer
Launch of the 2021 Winter Wage Series
This is the first of a multi-part series addressing current economic conditions and wage settlement trends. In this Winter 2021 Wage Series, we’ll bring you an update on CPI and economic developments, wage settlements, interest arbitration trends, statewide wage rankings for public safety classifications across the State, and an in-depth analysis of what factors appear to be impacting those rankings and settlements.
We will provide you a good overview of those trends but for the most detailed and complete look at wage rankings and settlements, you’ll want to explore our Premium Website. If you’re not currently a Premium Website subscriber you can review our services Cline and Associates Premium Information Services and contact Carly Alcombrack at Cline and Associates and she’ll explain how you can become one: CAlcombrack@clinelawfirm.com.
Over the next several articles in this series, we’ll present an in-depth discussion of recent contract trends and developments. The discussion will include an assessment of how the recent economic developments may impact your contract negotiations. In today’s article and an article to follow we’ll review the latest inflation data and inflation forecasts, with a discussion of how that could impact your approach to negotiations.
For current premium subscribers, below are links to some of the additional available CPI reports:
Seattle & All Cities CPI-W 2 Year Report
Seattle & All Cities CPI-W 3 Year Report
Seattle & All Cities CPI-W 5 Year Report
Seattle & All Cities CPI-W 10 Year Report
CPI-W Current Semi-Annual Report
Seattle & All Cities CPI-W Annual Report
The Latest CPI Numbers
The latest inflation reports show both the All Cities and Seattle numbers close, 1.4% and 1.6%. Over the last year, since April 2020, the Seattle CPI (W) fell from 2.6% to 1% in June 2020 with a rebound in August to 2.3% then back down to the current 1.6%. The All Cities CPI numbers followed the same pattern but 1.4% to 0.5% behind the Seattle numbers.
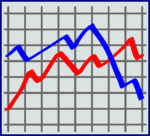
Here’s a graph that depicts the recent Seattle and All-Cities 12-month trend:
We generally review the bi-monthly CPI to track the figures according to the bi-monthly Seattle CPI release. The All Cities numbers are released monthly and, notably, this index had a high of 2.5% in January 2020, just before the pandemic. It fell to a low of negative 0.1% in May 2020 and has risen and held between 1.3 and 1.5% in the last 5 months of 2020. The Seattle CPI-W had a high of 2.6% in February and fell to 1% with a bump in August and then a decline ending in December only slightly higher than the All Cities number.
The Seattle index remained above the All Cities throughout the year. Although we have found an increasing number of labor agreements utilizing a flat dollar increase, those that use the CPI figures to determine wage increases overwhelmingly rely on the June figure.
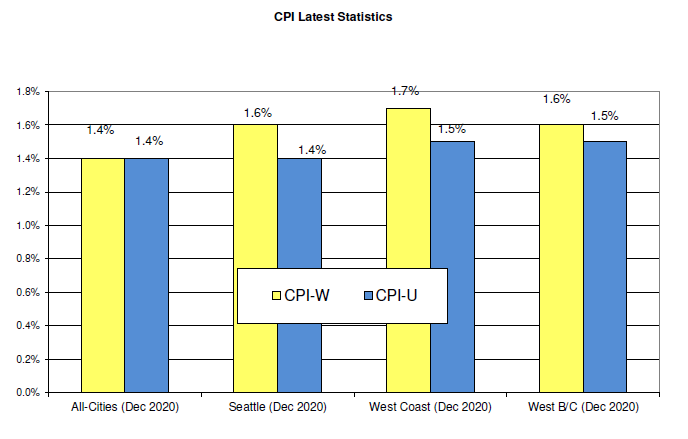
Here’s a graph showing other CPI indices commonly used for Washington public safety labor contract negotiations. This continues the slow downward movement for all the indexes since February 2020. The West Coast index has maintained slightly ahead of the Seattle indexes during this six-month period.
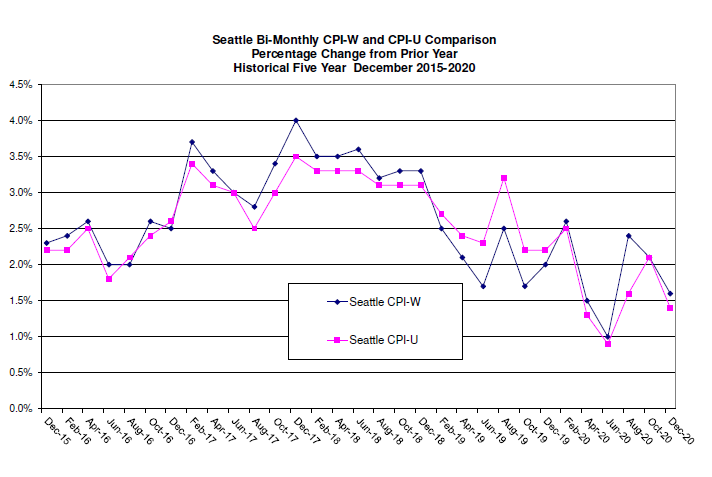
The Seattle CPI-W figure, which represents hourly wage earners, was consistently higher than the Seattle CPI-U in 2018. That changed in 2019 as the February and April numbers had the CPI-U, which represents wages of a broader section of incomes (including those who receive no income, retirement income, and salaried income) slightly higher. The CPI-U has been close to the CPI-W but slightly below during 2020.