Looming Economic Uncertainty Overshadows Today’s Report on Dip in National CPI Index

By Jim Cline

This morning’s monthly All Cities CPI report showed an inflation slowdown. But as it impacts labor negotiations, this development is dwarfed against the larger backdrop of economic and fiscal uncertainty.

Read more: Looming Economic Uncertainty Overshadows Today’s Report on Dip in National CPI Index

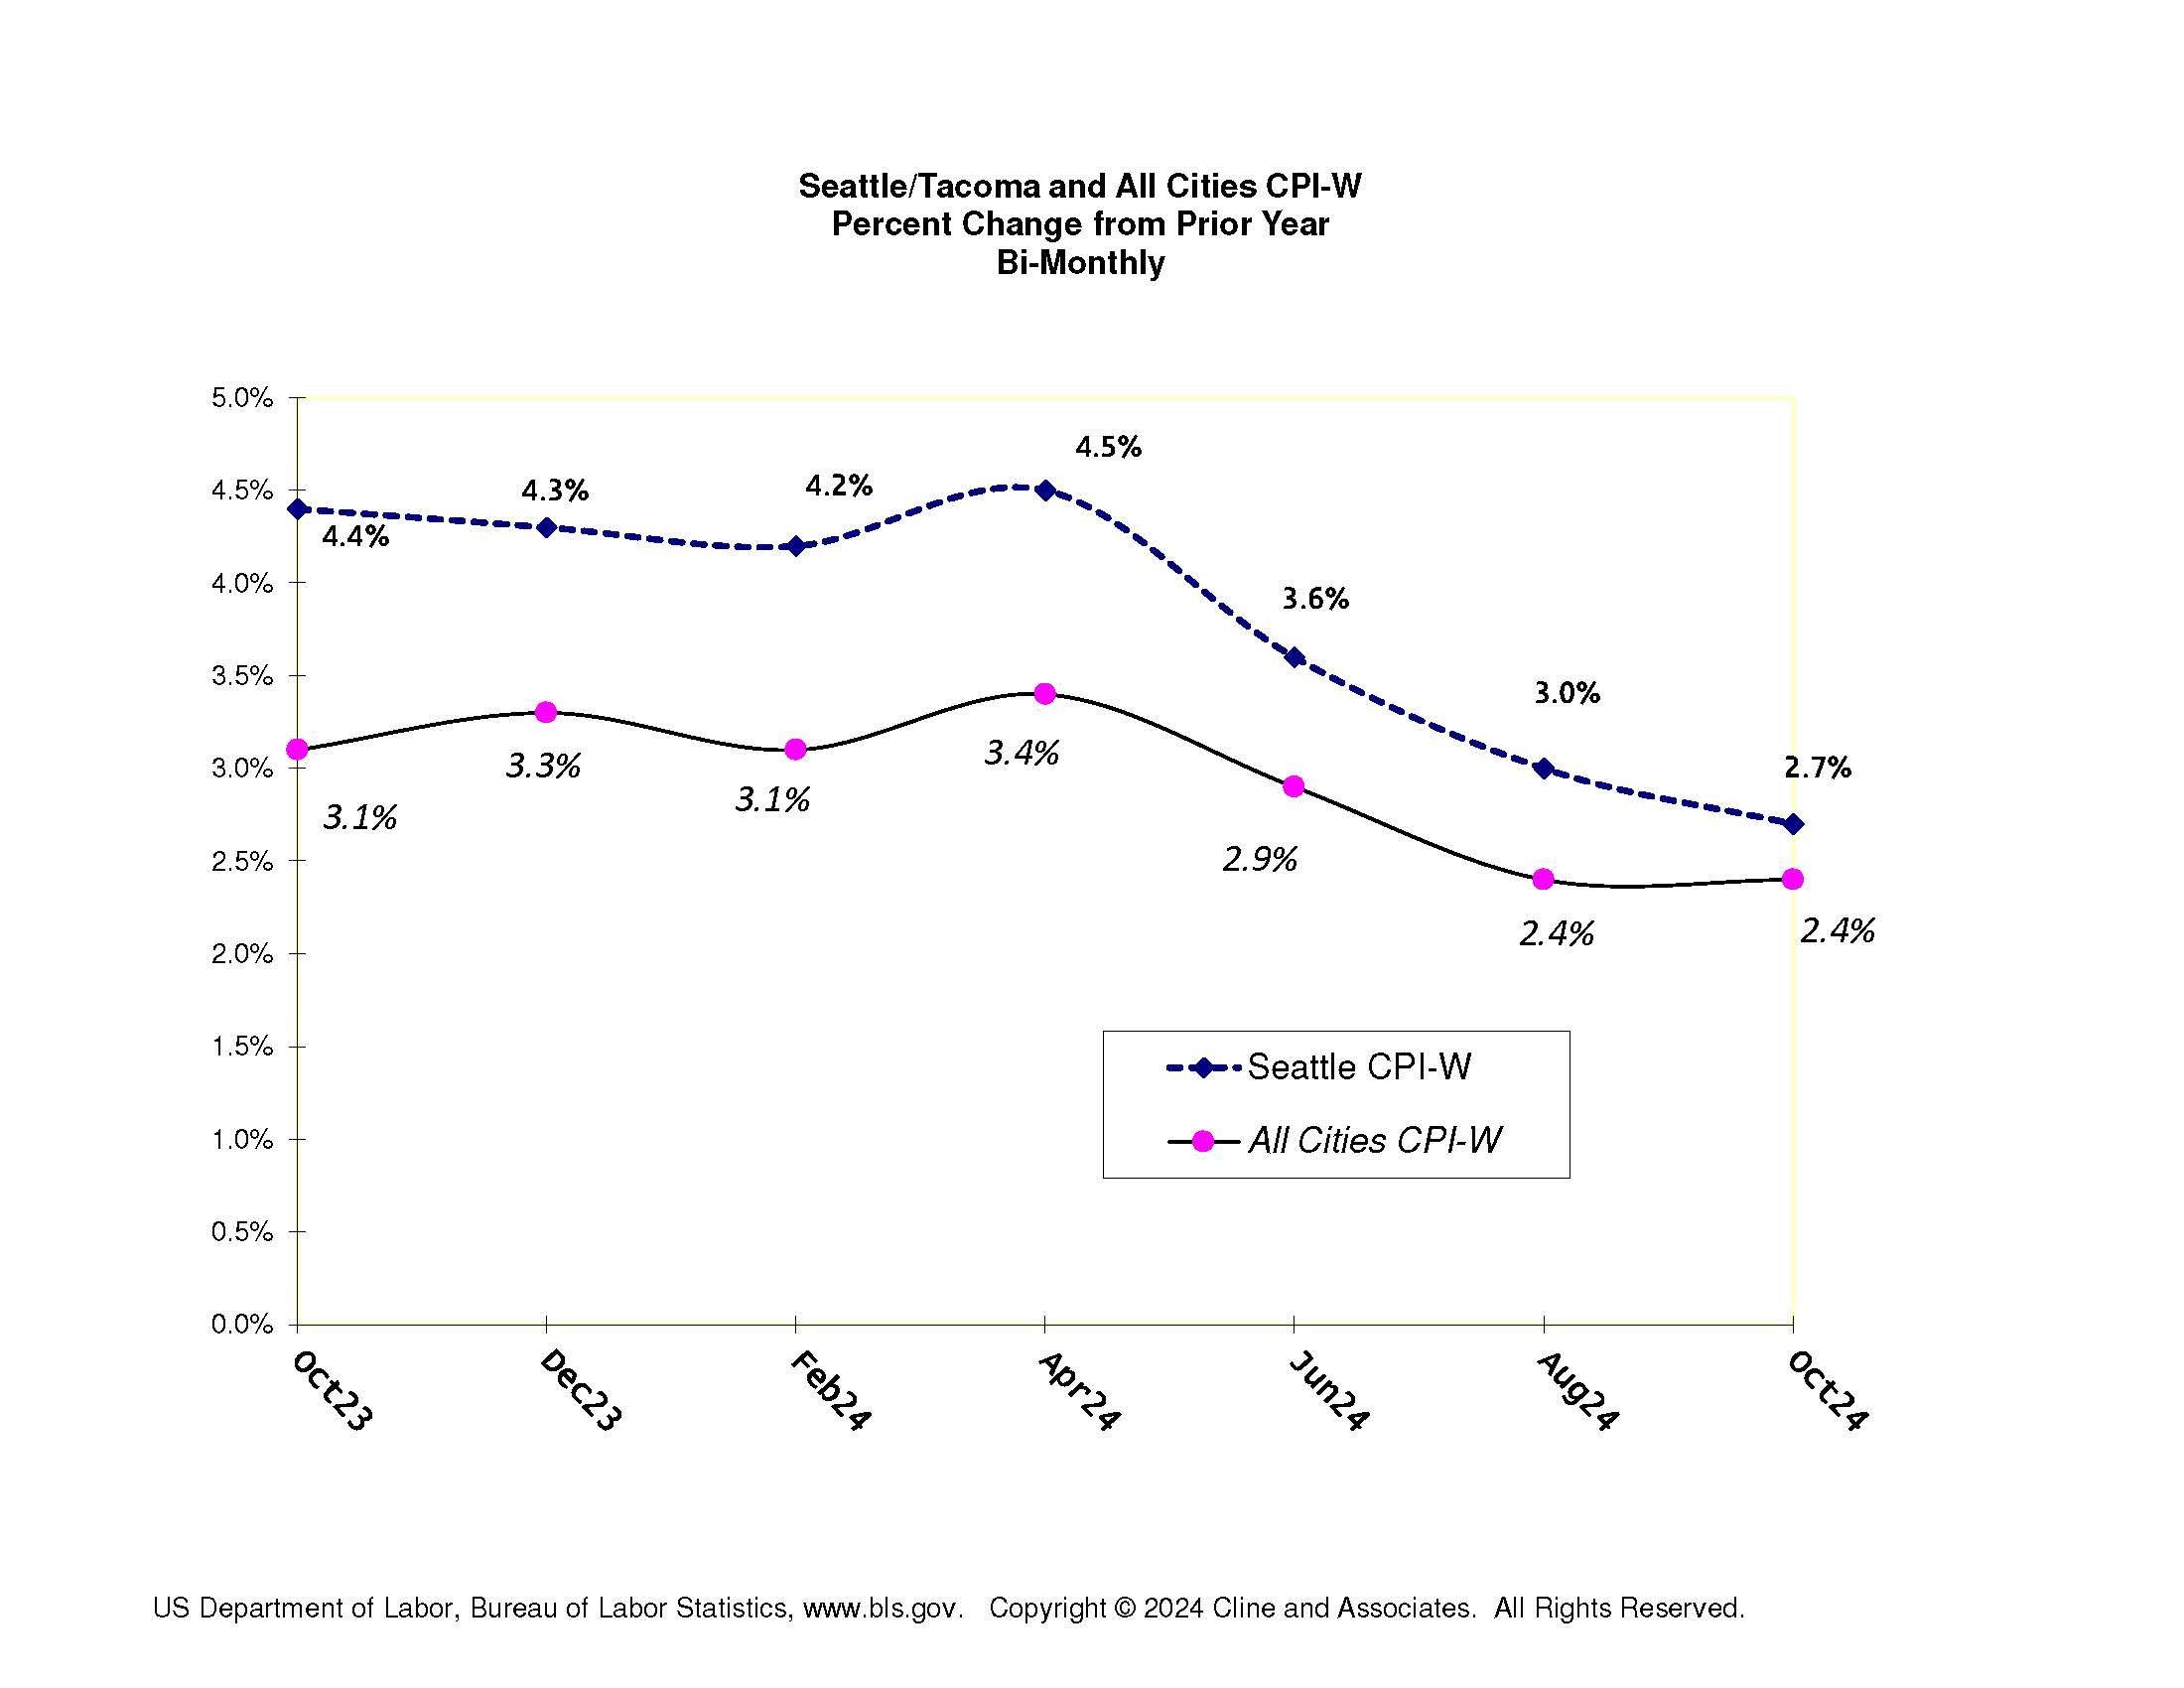
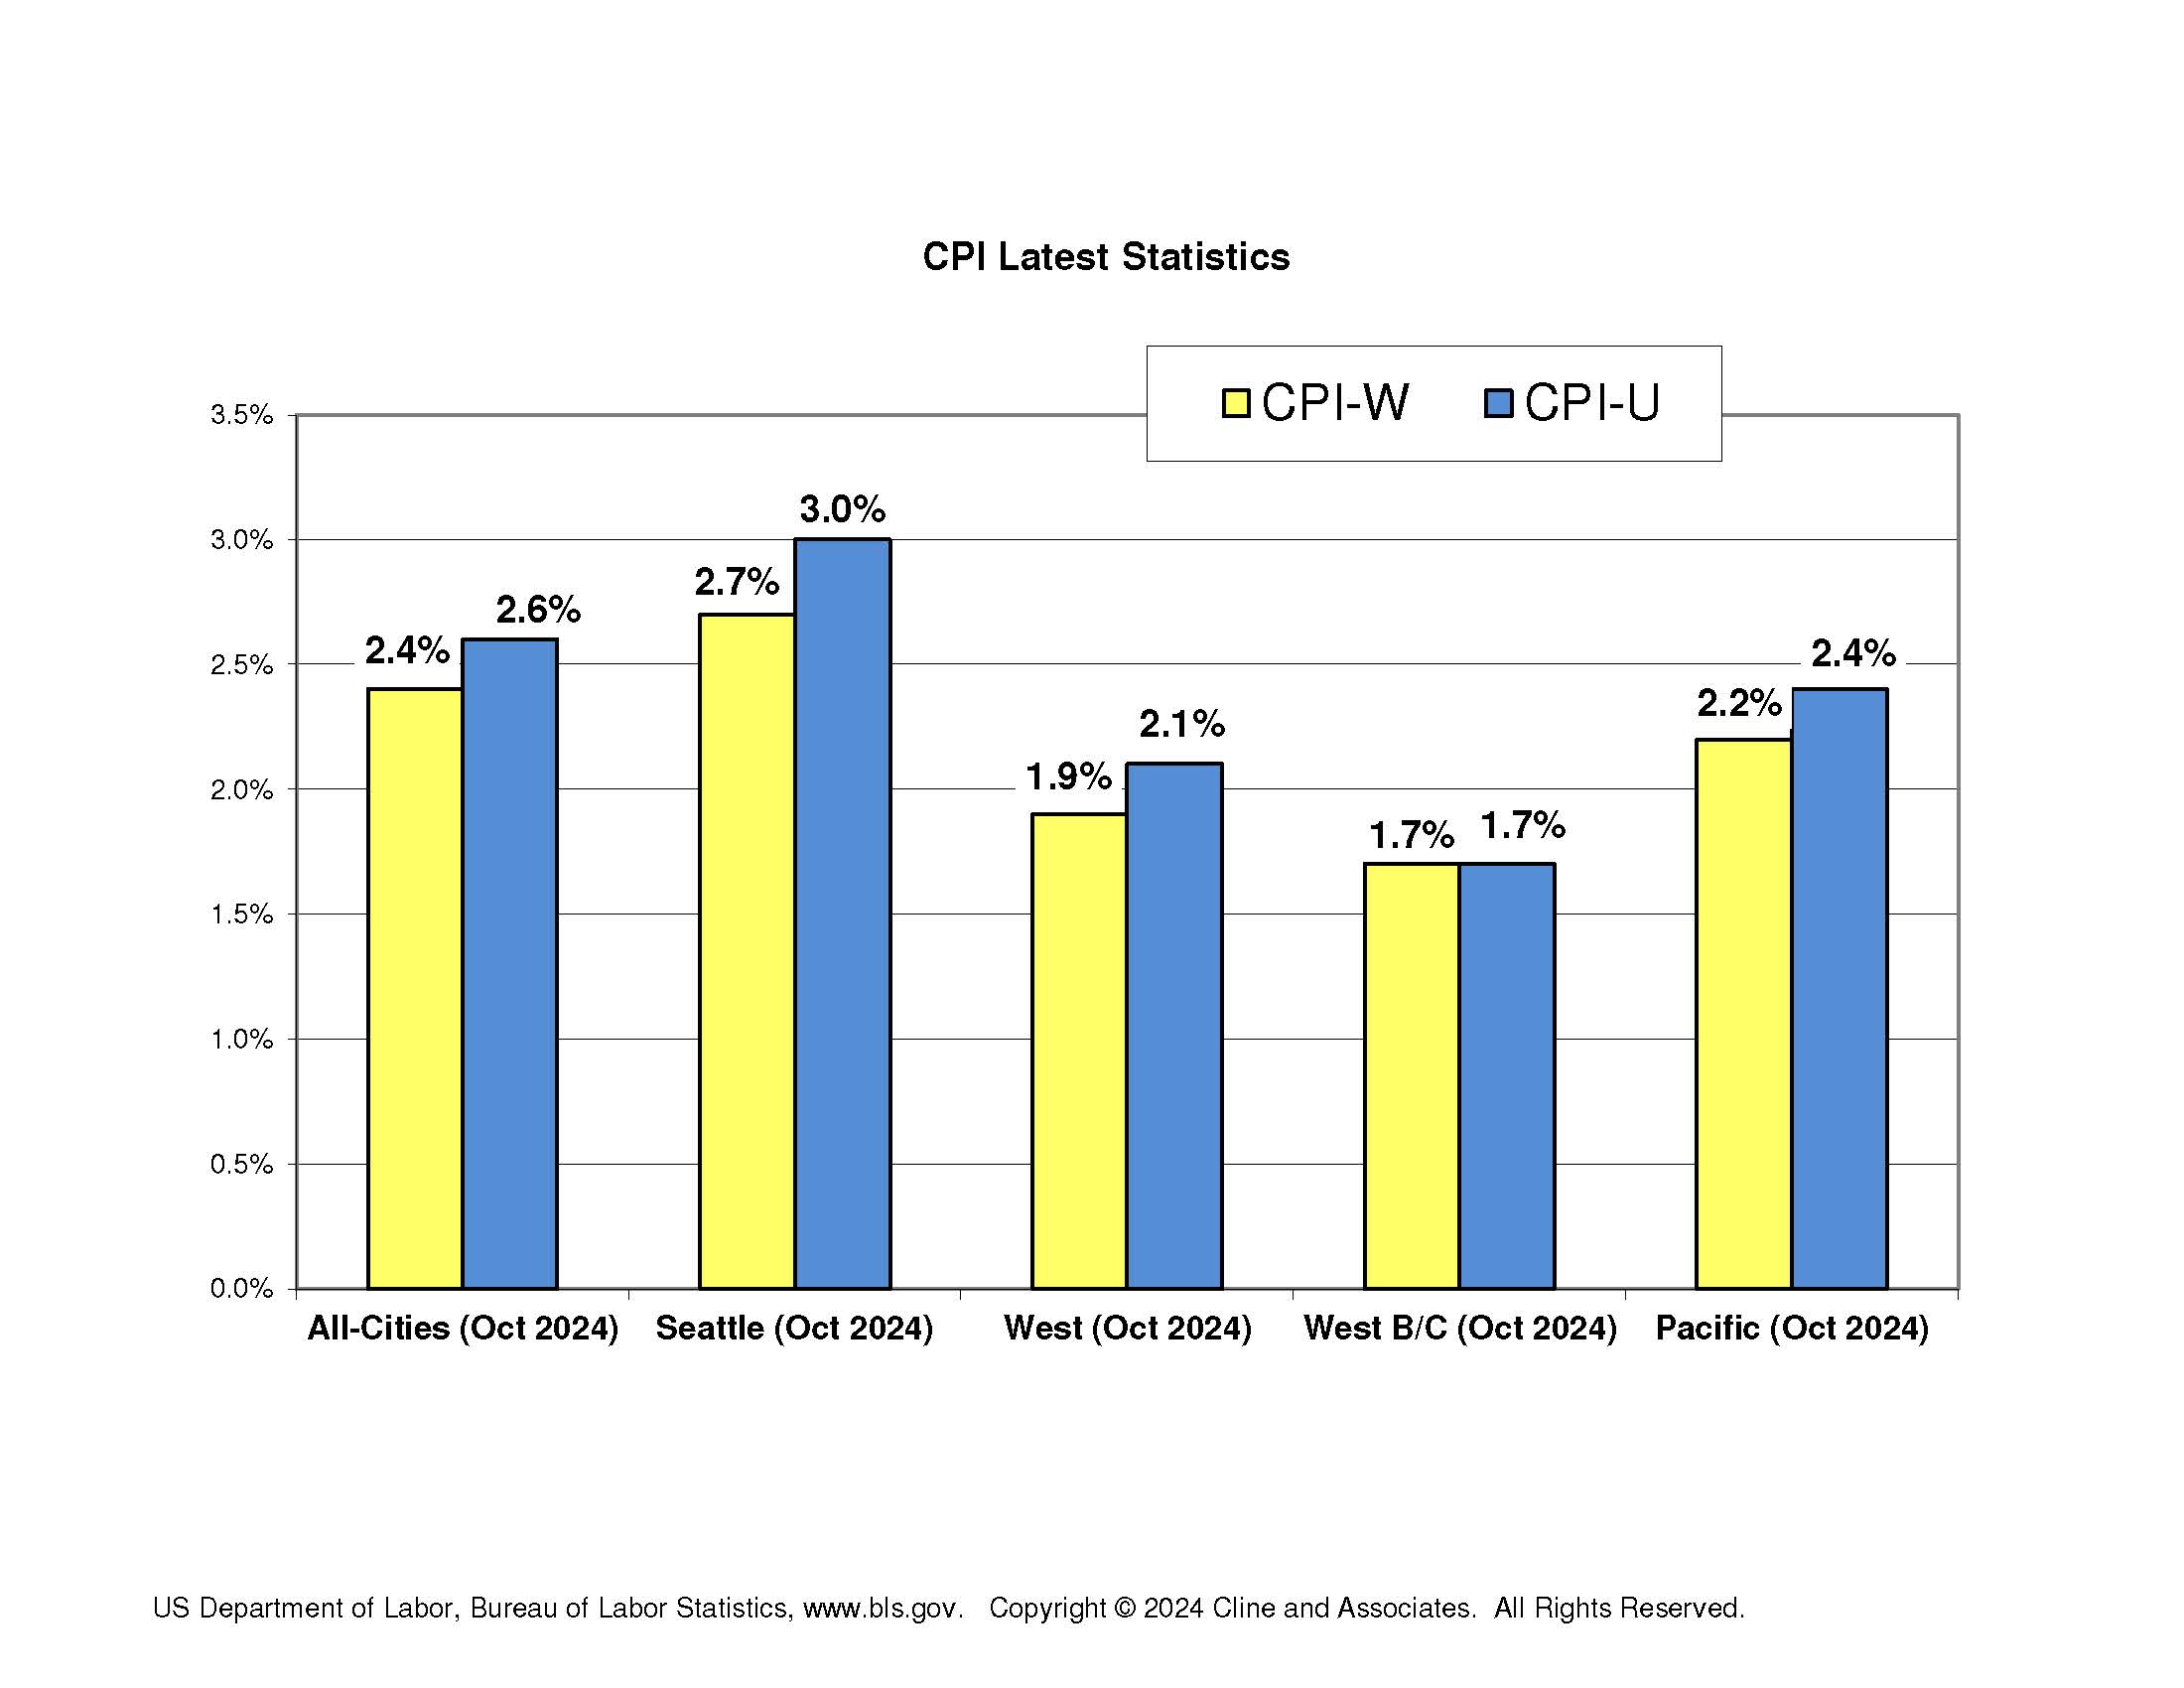
Today the BLS reported the March All Cities CPI at 2.4% for its “U” index and 2.2% for its “W” index. This is significantly down from the February numbers of 2.8% and 2.7%, respectively. The West indices showed similar declines.  “The Seattle numbers are reported bi-monthly with the April numbers to be released in mid-May.

This inflation drop exceeded economists’ expectations and would normally point to a reduction in the Fed discount rate, thereby allowing more economic growth. But this inflation news was generally discounted on a day where the stock market continued to fall on fear of the impact of pending tariffs. Economists also noted that the information seemed “stale” as it looked backwards to the end of March and doesn’t account for inflation pressures created by new and potential tariffs. Most tariff threats began after the beginning of April.

What does all this mean for pending and upcoming contract negotiations? There’s great uncertainty coming from different directions which makes any “crystal ball” cloudy at best. These are the three big factors we’re tracking now that would impact negotiations and all of them are very uncertain. These include the recession or economic slowdown risks, the inflation outlook, and the Washington State and local government budget outlook.

National Economy is Uncertain but Recession Risks Rising. The significant drop in the stock market, which continues this morning as I write this, is a concern on its own but more importantly, it’s based on markets anticipating a significant slowdown in the national economy.

At the start of the year, most economists placed the changes of a recession fairly low. The Wall Street Journal panel, reflecting a broad array of economists, placed the risk of a recession this year at 22%. They also predicted a continuation of the current historically low unemployment rates.

The announcement of widespread tariffs, since modified, sent the stock market spinning. It prompted an increase in the number of economists predicting that a recession by year’s end was either probable or highly possible. Day to day predictions varied following the rapidly evolving tariff news. Goldman Sacks, for example, had increased its recession prediction to 65% and then lowered it immediately to 45% upon the announcement of the partial tariff suspension.

The general state of the economy has significant implications for negotiations as it directly impacts local government revenues as well as broader labor market conditions. Even if no recession materializes, it seems most likely that that there will be some significant slowing of the economy.

Future CPI Direction is Uncertain. Despite today’s dip in inflation, most economists have said that any tariffs would increase inflation pressures, possibly adding one or two percent to the existing inflation rate. The Federal Reserve shares this view, leading them to maintain higher interest rates. Almost any current prediction is tied to how widespread new tariffs are. While the Trump Administration announced a 90-day suspension of most tariffs, the tariffs on China are moving forward. And there’s no certainty about what follows this temporary suspension.

Given the relationship between CPI data and year over year contract wage increases, the uncertainty about the direction of inflation complications any negotiations, especially for wages for 2026 and beyond. Many contracts are tied to a specific CPI formula and those that are not at the very least are built upon some assumption of the direction of the cost of living. Most bargaining teams seek to obtain a wage increase that is at least equal, if not greater than, the expected inflation. Where expectations are uncertain, negotiations are more challenging.

State and Local Governments Budgets are Uncertain. The State budget was already looking at painful cuts possibly to be offset by tax increases even before the tariff developments.  State government employees were facing furloughs. Any reduction in State spending is likely to have some impact on local governments whose budgets rely on a variety of State funds and grants.

City and county budgets were already facing significant challenges. For the past year or two, sales tax receipts have been fairly flat.

One positive possibility and one not without controversy, is pending legislation to increase property tax revenues. The State Senate and House have pending bills that would modify the existing 1% limit on property tax increases. The bill versions are different, and passage is uncertain but if adopted it would allow some increases above the current 1% cap to be tied to inflation and population growth. The House version retains a 3% limit while the Senate version is only limited by inflation and population growth.

The Tim Eyman initiative that created the existing 1% limit is a significant constraint on local government budgets, especially counties and fire districts that are heavily dependent on property tax revenues.  AWC is pressing for this lift and is supported by a broad coalition.

The status of this proposal likely won’t be known until the end of the legislative session. How much this lift will generate even if adopted will still remain uncertain. The legislation would not automatically increase property taxes but would allow local governments to lift their levy up to the maximum under whatever formula may be adopted.

Future developments. We will be keeping a close eye on these and other developments. A clearer picture, whether better or worse, seems likely to emerge in the next few months. We are planning a webcast to discuss these and other issues later this month.

Premium Website Information. For broader information on these developments and data  obtain premium website credentials and visit the premium website, Premium website subscriptions include access to Cline and Associates webcasts.

Why are the “Seattle” indices important and What’s up with them?

By Jim Cline

In Monday’s newsletter, we reported on the last All-Cities and Seattle CPI from February. That report showed that the Seattle indices, which had been running a percentage point or two over the All-Cities number are now coinciding with the All-Cities numbers and actually a fraction of a percent lower. This raises a recurring question on the differences between these indices and the pros and cons of each.

Read more: Why are the “Seattle” indices important and What’s up with them?

First, there needs to be an understating of the scope of where these numbers come from. The Seattle indices (“U” and “W”) do not cover simply costs within the City of Seattle but cover use sampling from all of King, Snohomish, and Pierce counties. BLS used to include adjacent urban Counties in the Seattle CMSA region like Kitsap and Thurston but eventually narrowed the geographic scope of this index.

Still, because those adjacent areas likely have their cost of living impacted more by Seattle Metro trends than national trends, it is common to use the Seatle numbers in negotiating contracts throughout Western Washington and even sometimes in Eastern Washington. Housing prices and other components of the cost of living throughout the State are much more likely to be influenced by what’s happening in the Seattle area than what is occurring in the Midwest or East Coast. And when you are using comparables that are located inside the Seattle Metro area, it’s likely that you are looking at the trends and expected trends for those contracts with a goal of keeping pace with those trends.

We have written on many occasions that there’s been a long term tendency of the Seattle indices to outpace the national indices. What’s been noteworthy recently is how much that has occurred. Two years ago, the All-Cities CPI was 2.3% while the Seattle number was 4.5%. While it is not uncommon for the Seattle numbers to outpace the national numbers by a fraction of a percent, that 2.3-point difference is remarkable and, as we expected, not likely to be long sustained. By last June the gap (had closed to a percentage (4.3% versus 3.3%).

Since that time the Seattle indices have continued to subside. As we explained in December, the large gap that had existed between the Seattle and national numbers is closing. And this month, as indicated above, the Seattle numbers are slightly lower. And as our report on the February numbers show, the gap has now disappeared.

That doesn’t mean that the Seattle indices, at least over time, won’t ride a slight amount above the national numbers. As long as the Seattle regional economy continues to perform strong the related inflation pressures, especially on housing costs, will continue. We have said repeatedly that if you were to tie your contract to a particular index, the Seattle index is a better bet in the long run than the All Cities, and we continue to make that recommendation for now.

Economic Factors Developments Complicate Bargaining Picture

By Jim Cline

In our last newsletter, we discussed the February CPI Report. In this article we discuss other economic developments, including state and local revenue forecasts.

Read more: Economic Factors Developments Complicate Bargaining Picture

Other than a slight rebound in past week, most of the recent economic news has not been good. The University of Michigan consumer sentiment survey also showed a dramatic drop in consumer confidence. The tariff wars concern economists and the broader stock market. The drop in consumer confidence is likely to impact consumer spending.

Last week Federal Reserve Chair Powell expressed a concern that tariffs could impact inflation and he was anticipating at least somewhat higher inflation in 2025. Those Fed projections will result in at least some delay in any interest rate reductions which will inhibit economic growth. Increasingly economists, including the Fed, are expressing some concern of the possibility of “stagflation” — the combination of inflation and a slower economy.

Over the past week the stock market has stabilized indicating that at least investors think that a recession may be avoided. But a number of economists have increased their projections on a possible 2025 recession from remote to much more possible.

A drop in consumer spending will have a potentially significant impact on Washington local government revenues. Statewide sales tax revenues for 2024 were flat relative to 2023, and 2023 revenues were up only modestly compared to 2022. On the other hand, those same revenues rose dramatically since 2018 and until recently cities and counties were in a seemingly strong fiscal position. The Cline and Associates premium website contains details sales tax revenue data, including breakouts by city and county.

Just last week the State released an updated revenue report that shows revenues lower than had previously been projected, largely because of the plateauing of sales tax revenues. The flat revenue picture has already impacted the State budget with State budget cuts anticipated. Damage from state budget cuts is ordinarily not limited only to state agencies. In many direct and indirect ways, local governments benefit from a strong state budget.

There are numerous Washington cities and counties that had already predicted possible budget cuts for 2026 and beyond budgets. Pending and uncertain are the request by cities and counties to raise the property tax levy restrictions and other revenue to allow more local government taxing capacity. The outcome of those efforts may not be clear until later in the spring.

February CPI Release Reports Slight Easing of Inflation — For Now

By Jim Cline

The Bureau of Labor Statistics released their bimonthly inflation report March 12 showing inflation through February. Most economists had projected that All Cities CPI would be around the 3.0% mark reported in the January inflation report but instead a slight dip was reported. Another notable trend is that, as we have been anticipating, the Seattle indices have continued to slow, and Seattle area inflation is reported as slightly less than national numbers.   

Read more: February CPI Release Reports Slight Easing of Inflation — For Now

This graph shows the bimonthly movement in inflation over the past year, including the latest numbers:

The numbers above drive many contract negotiations, but they are not the only numbers in use. This chart shows some of the other often used indices including the “U” numbers and the West Coast numbers:

Absent a significant economic slowdown or recession (discussed below), many economists anticipate that upcoming inflation reports will be higher, probably north of 3%. While inflation had been expected to continue its trajectory towards the Fed’s 2% inflation target, the surging tariff wars and expected to create some bump in inflation. Almost all economists agree that increased tariffs will create an increase in inflation, but they differ as to the extent and how long lasting the inflation impacts will be. This morning’s CPI report may represent the low point in inflation for the year.

Last week’s University of Michigan consumer sentiment survey also showed consumers anticipating more inflation ahead. Inflation expectations are problematic because they influence the direction of inflation. Economists believe expectations of higher inflation spur wage demands which create higher levels of inflation.

In the next newsletter article, we’ll address other economic developments impacting bargaining.

Seattle CPI Moves Closer in Line with National CPI

By Jim Cline and Kate Kremer

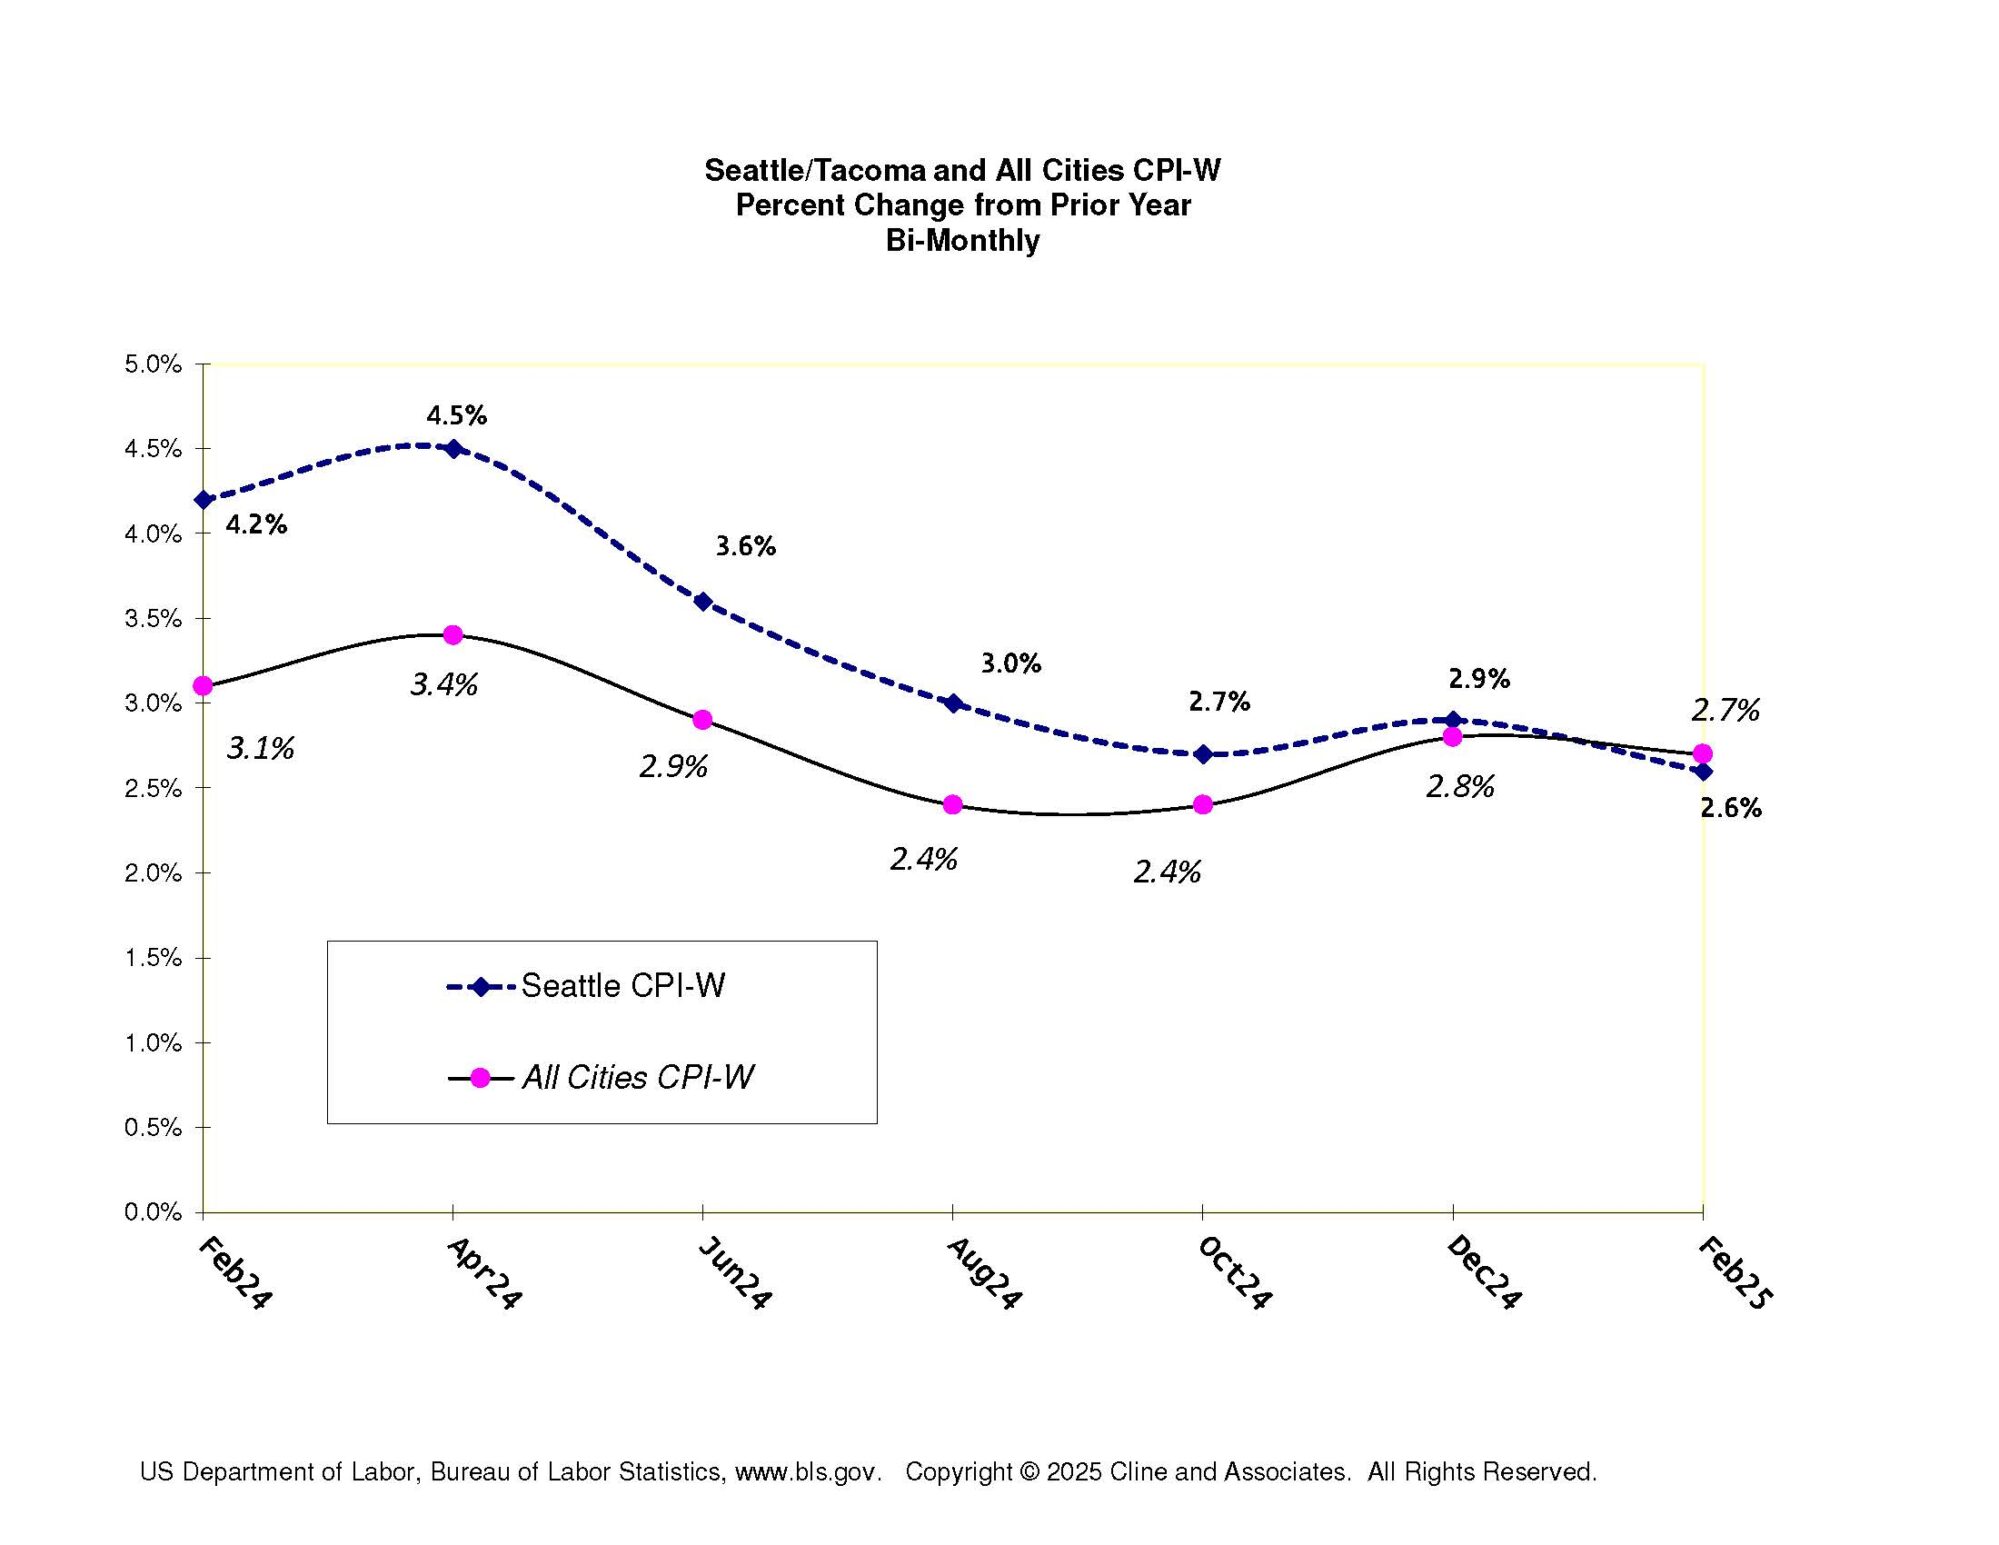
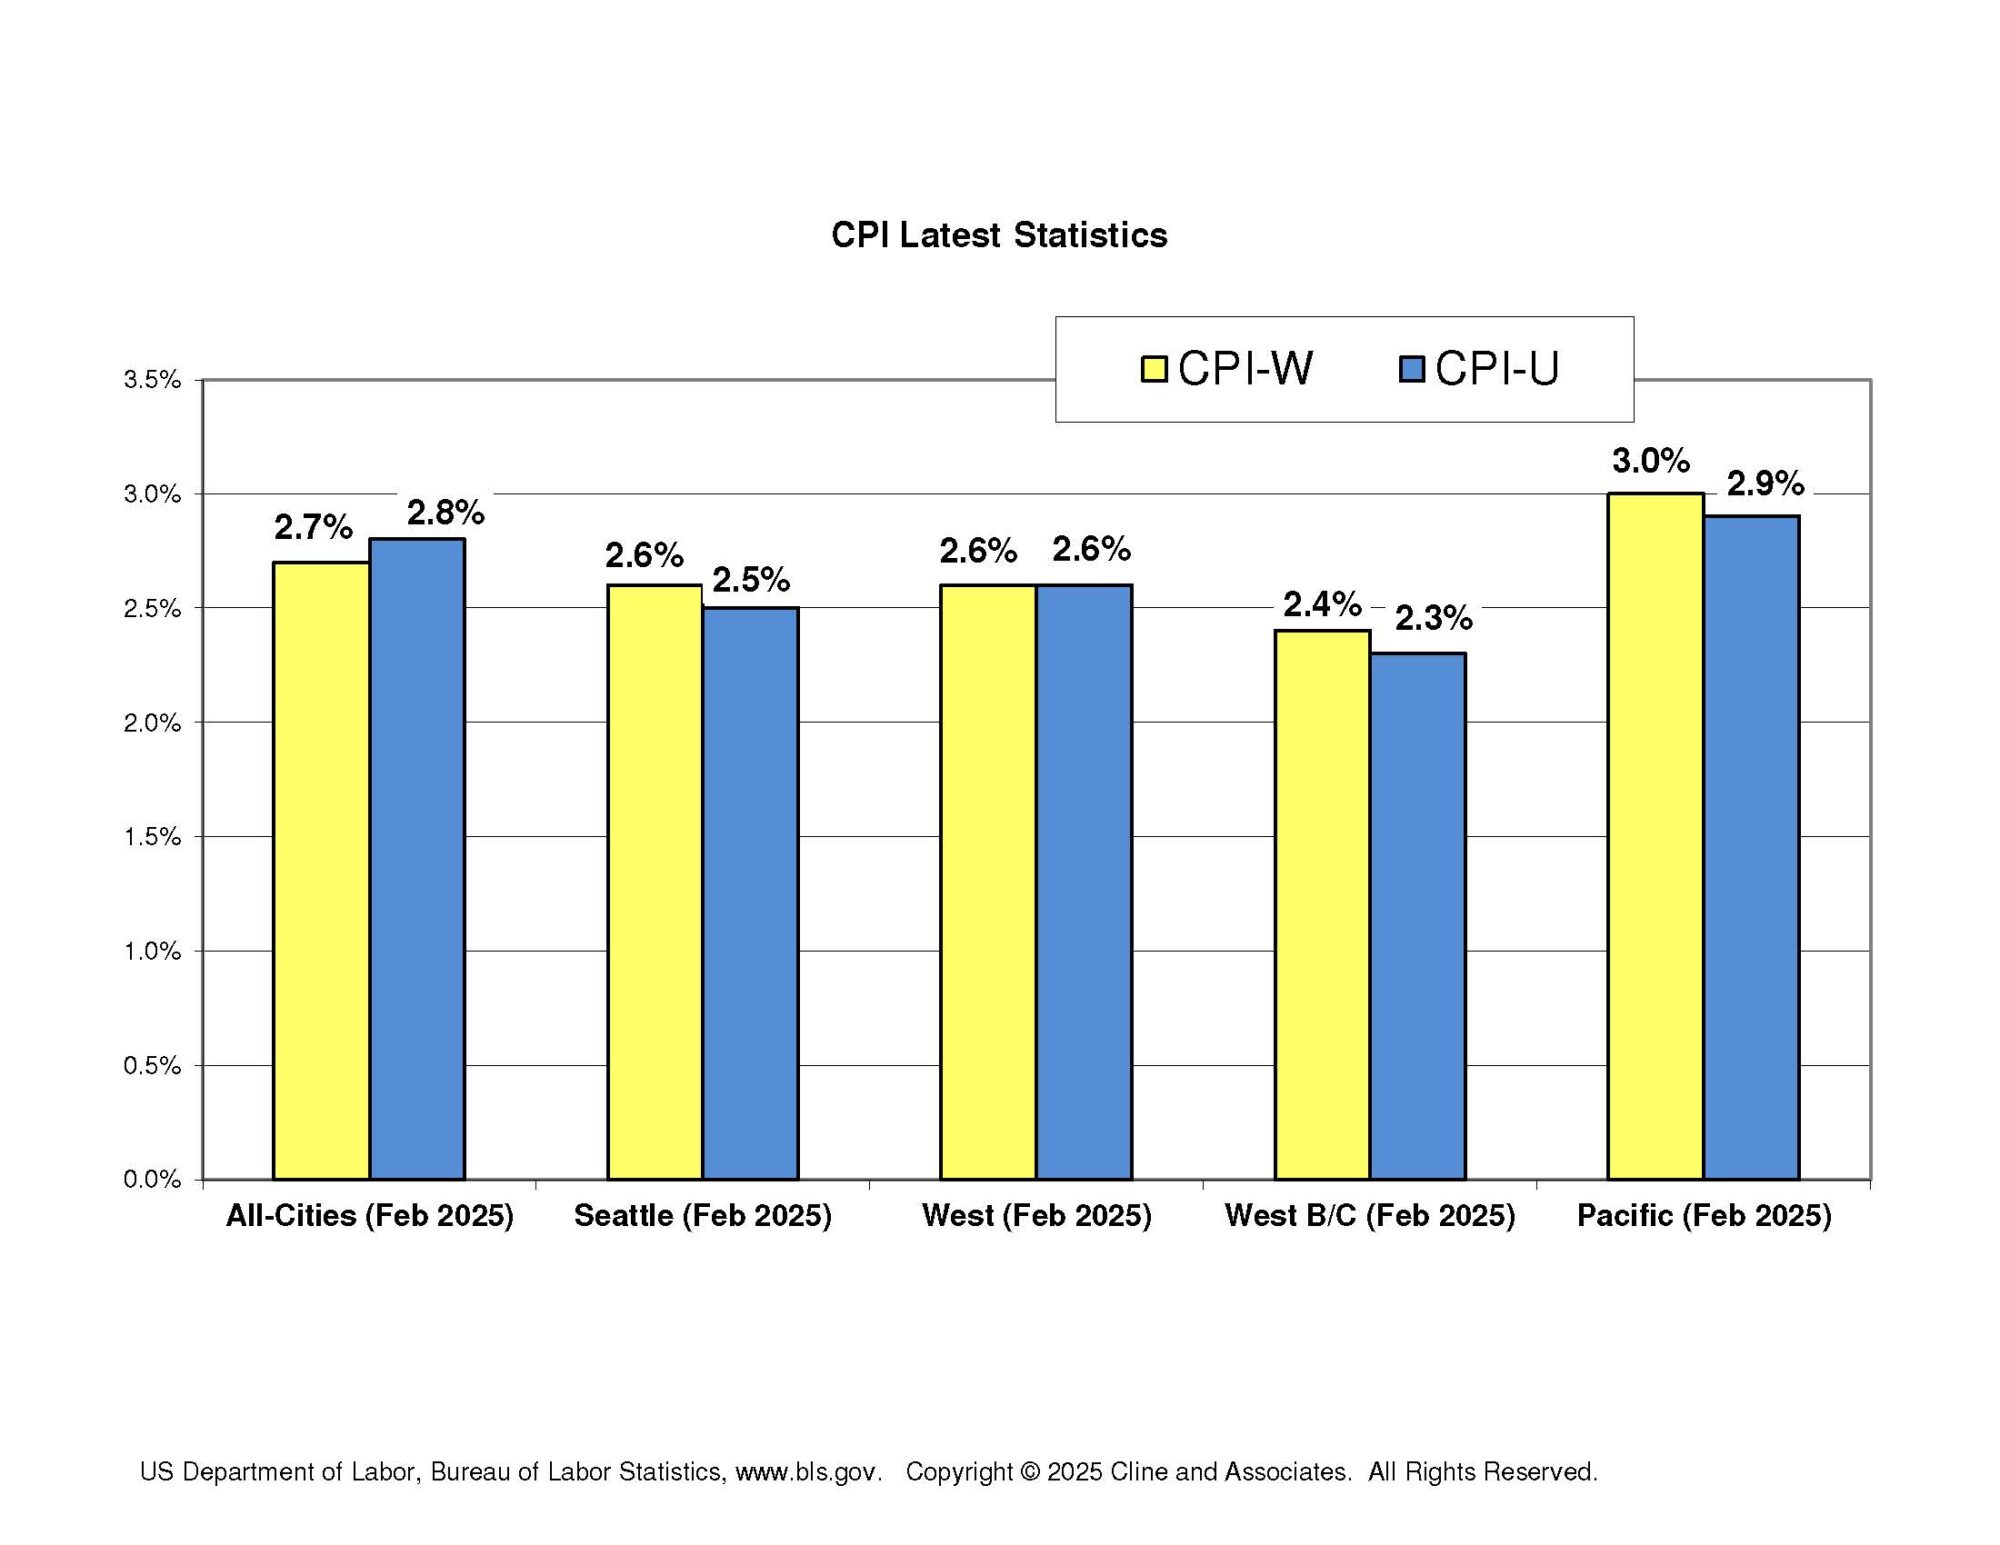
The latest CPI data shows a continued easing in inflation. The period of higher inflation of the past few years seems to be ending at least for now. And the large gap that had existed between the City and All Cities CPI also seems to be closing.

Read more: Seattle CPI Moves Closer in Line with National CPI

This chart shows the most recent CPI released earlier this month by the Bureau of Labor Statistics, along with the 12-month bi-monthly numbers:

For most of the past year, the Seattle CPI has outpaced the national numbers by more than one percent. A year ago, the Seattle and All Cities W index were 4.4% and 3.1%, respectively. As shown, those numbers are now 2.7% and 2.4%. 

Here’s a summary of both the “U” and “W” numbers on a range of CPI formulas most commonly used in Washington public safety contracts:

Since the heightened CPI over the past few years has led to an increase in overall settlement trends, we are anticipating these new, lower numbers will likely lead to a reduction on those trends. But there are many variables impacting those trends. One major factor is that a number of jurisdictions which settled contract at far less than CPI over the past few years are likely to negotiate for some type of “catch up” increases. So far, the preliminary data we are seeing for 2025 settlements show many settlements at 4% or more. We will follow up with another report soon on those developments.

Why are the “Seattle” indices important and What’s up with them?

Why are the “Seattle” indices important and What’s up with them?

By Jim Cline and Kate Kremer

In the last couple of articles, we discussed the recent BLS June CPI data and why the June CPI numbers have outsized importance. In this article we discuss the so-called “Seattle” CPI index. There’s often confusion about exactly what the “Seattle” CPI index is and how it impacts negotiations around the State. We’ll address those questions today.

Read more: Why are the “Seattle” indices important and What’s up with them?

First of all, The Seattle indices (“U” and “W”) do not cover simply costs within the City of Seattle but cover use sampling from all of King, Snohomish, and Pierce counties. BLS used to include adjacent urban Counties in the Seattle CMSA region like Kitsap and Thurston but eventually narrowed the reach of this index.

Still, because those adjacent areas likely have their cost of living impacted more by Seattle Metro trends than national trends, it is common to use the “Seattle” numbers used in negotiating contracts throughout Western Washington and even sometimes in Eastern Washington. Housing prices and other components of the cost of living throughout the State are much more likely to be influenced by what’s happening in the Seattle area than what is occurring in the Midwest or East Coast. And when you are using comparables that are located inside the Seattle Metro area, it’s likely that you are looking at the trends and expected trends for those contracts.

We have written on many occasions there’s been a long-term tendency of the Seattle indices to outpace the national indices. What’s been noteworthy recently is how much that has occurred. One year ago, the All-Cities CPI was 2.3% while the Seattle number was 4.5%. While it is not uncommon for the Seattle numbers to outpace the national numbers by a fraction of a percent, that 2.3-point difference is remarkable and, as we expected, not likely to be long sustained.

We had expected (and predicted) some closing of the gap in this report, but this gap is closing even faster than we had predicted. We had more recently been expecting Seattle June numbers at or just about 4%, maybe even higher. These numbers coming in under 4% likely show the levelling off of housing prices, the factor that creates the biggest over difference between the national and Seattle formulas.

That’s the look backwards. Looking forwards, we are expecting the gap between these two numbers to continue to close further in the months ahead. If the national inflation trends continue their decline, as expected, to get closer to 2% over the next year or two, we would expect that Seattle would follow on that.

That doesn’t mean that the Seattle indices, at least over time, won’t ride a slight amount above the national numbers. As long as the Seattle regional economy continues to ride as strong as it has over the past several years, the related inflation pressures, especially on housing costs, will continue. The strong economy places demand pressures throughout the economy that simply and directly drives up prices for everything. We have said repeatedly that if you were to tie your contract to a particular index, the Seattle index is a better bet than the All Cities, and we continue to make that recommendation.

In our next newsletter, we’ll discuss our preliminary assessment as to how these inflation developments may impact current and near-term contract negotiations.

Why are the “June CPI” Numbers Important?

Why are the “June CPI” Numbers Important?

By Jim Cline and Kate Kremer

In our last newsletter we discussed the most recent inflation report from CPI. It shows the All-Cities “W” index inflation had decelerated to 2.9% and the corresponding Seattle inflation index had dropped to 3.6 (down from 4.5% just in April). The less commonly relied upon Seattle “U” index was notch higher at 3.8%. Other West Coast indices were close in line with the All-Cities numbers.

[Read more…]

Recent June CPI Release shows Cooling National Inflation and Further Cooling in the Seattle Numbers

Recent June CPI Release shows Cooling National Inflation and Further Cooling in the Seattle Numbers

By Jim Cline and Kate Kremer

The Bureau of Labor Statistics released their bimonthly inflation report two weeks ago showing inflation through June. We have previously reported on the slowdown of inflation with predictions of further slowdown ahead. This report confirms that expected trend. Most notable about the June report is that anticipated cooling of the “Seattle” numbers is materializing.

[Read more…]

How Will Binding Interest Arbitration work for Dispatch Bargaining Units?

How Will Binding Interest Arbitration work for Dispatch Bargaining Units?

By Jim Cline

In our recent newsletters we discussed the extension of arbitration to emergency dispatchers (Newsletter 4/26/24). In the last article, we discussed what the chief interest arbitration factors were under law and arbitration precedent (Newsletter 4/29/24). We noted in that article that there may be some complexities in extending those principles to dispatchers and we discuss that here.

[Read more…]

How Washington Interest Arbitration Provisions will apply to Newly Extended E911 Centers

How Washington Interest Arbitration Provisions will apply to Newly Extended E911 Centers

By Jim Cline

In the last newsletter, we discussed that the Washington legislature has extended binding interest arbitration rights to emergency dispatchers. In this article, we discuss some practical questions about how interest arbitration would work, specifically for E911 employees.

[Read more…]