By Jim Cline and Kate Kremer
 In the last article in this series, we briefly discussed the Washington tax system and how it impacts local government revenues. In this article, we will discuss the current revenue situation.
Notwithstanding the strong economy, we often see employers claim that their revenue and budget limit their ability to meet your wage demands. Currently, few are saying that they don’t have the money in their budget (as that generally would be untrue) but they frame the issue in terms of “sustainability.” They claim they can’t add money to salaries to keep pace with inflation because it wouldn’t be “sustainable” over the long term.
In fact, most local government revenues are keeping up with or even outpacing the rate of inflation. So, they are in a good economic position even before we consider American Rescue Plan Funding, which provides jurisdictions a virtual windfall of cash. Although that money is “one time” money, it is a very significant amount of “one time” money that had the effect of adding to most government reserves. They are also seeing some surprising and unexpected spikes in their sales tax revenues.
We have been closely tracking the sales tax revenue distributions to cities and counties since the pandemic started because we wanted to better understand how the pandemic ups and downs were impacting revenues. Here’s a chart we prepared that shows the statewide sales tax revenue totals from January to June (semiannual) for local governments over the past few years:
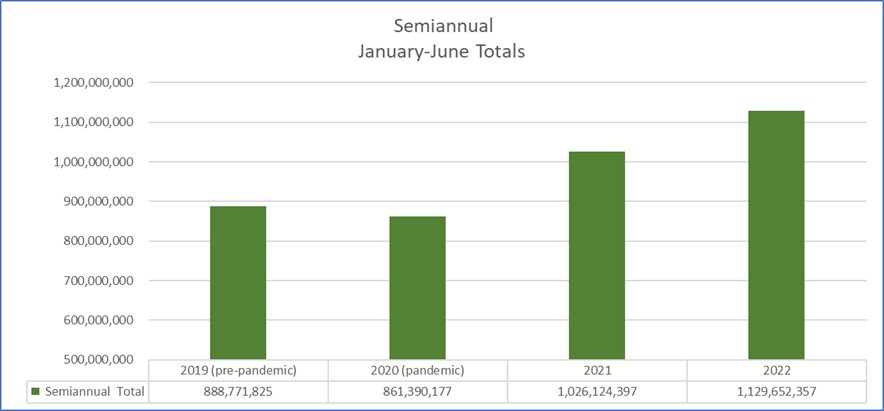
We took the most current data available for sales tax distributions in 2022 and then compared them to the prior years. These numbers represent a statewide summary for the first half (January-June) of each year. However, if we’re in bargaining on your contract, we can quickly locate the specific updated sales tax numbers for your jurisdiction. Here’s a link on the premium website for our sales tax reports that include individual jurisdictions throughout the state. As we’re prepping for bargaining it is critical that you locate and study those reports, especially in the current economic environment.
You’ll especially want to understand the trajectory of revenues, something that this graph shows:
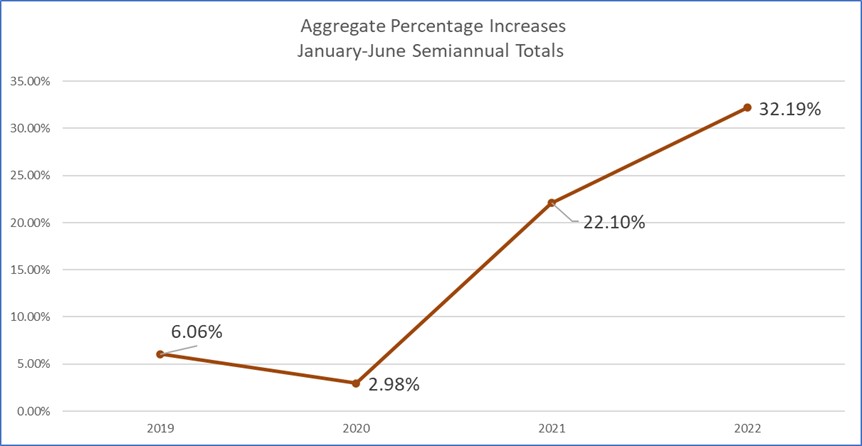
Using 2018 as the starting year, this graph shows how the statewide semiannual revenue totals have increased or decreased each year since 2018. There was a 6% increase in revenue from 2018 to 2019. The graph shows a 3% decline (from 6% to 3%) in revenue during the first half of 2020 as compared to the first half of 2019, precipitated by the pandemic’s economic impacts. Yet in the first half of 2021 and continuing into the first half of 2022, the percentage increases have risen dramatically.
This substantial increase in sales tax revenues is important. We started analyzing these numbers in the fall of 2020 as we saw these sales tax numbers coming in, and employers at that time were claiming that they were completely broke and budgets were decimated due to the pandemic. It was true that in the first half of 2020 there was a dip in revenues. But as we got to the back half of 2020 the economy rebounded fairly strongly. In fact, the sales tax distributions from the first half of 2021 were 19% above the same period in 2020. Additionally, the sales tax distributions from the first half of 2022 were 10% higher than in 2021. This is substantially above the rate of inflation.
So, it if the employers are saying, “our sales tax revenues aren’t really keeping up”, this counters our findings. Note, however, that the picture for individual cities and counties can look quite a bit different.

