By Jim Cline and Kate Kremer
 Earlier this month we presented a webinar covering recent inflation and contract settlement trends with a focus on what lies ahead for groups currently in negotiations or planning to start them soon. The webinar and transcript are available on our Premium Website. This article is the first of a series on these issues.
In future articles in this series, we’ll explore inflation predictions, along with other important economic indicators. We’ll be covering recent contract settlement trends and what all this means for future contract settlements.
We will also take a look back at the last time period with back-to-back years of high inflation — the late 1970s and early 1980s and discuss how arbitrators decided wage issues in that environment. The logic follows that the patterns we’ve observed are directly applicable to how arbitrators will likely treat wage issues in a similar environment today.
In this particular article, we’ll provide some recent inflation numbers. Notably, these numbers are dramatic and are having a marked impact on negotiations.
CPI figures are reported monthly or, in the case of the Seattle index, bimonthly. Our experience over decades of negotiating labor contracts informs us that the June CPI report has the greatest impact on negotiations. Across the State, contracts differ as to whether they use the Seattle, All-Cities, or one of the “West” indices (all of which include both “W” and “U” measures).
A growing number of contracts include one of these CPI indices to determine the next year’s wage adjustments. Even those that use a percentage increase rather than a CPI formula are nonetheless negotiated with an eye on these June numbers. As we’ve explained, these June numbers are a major “driver” of negotiations.
This graph shows the 12-month trend in the Seattle and All-Cities June “W” CPI:
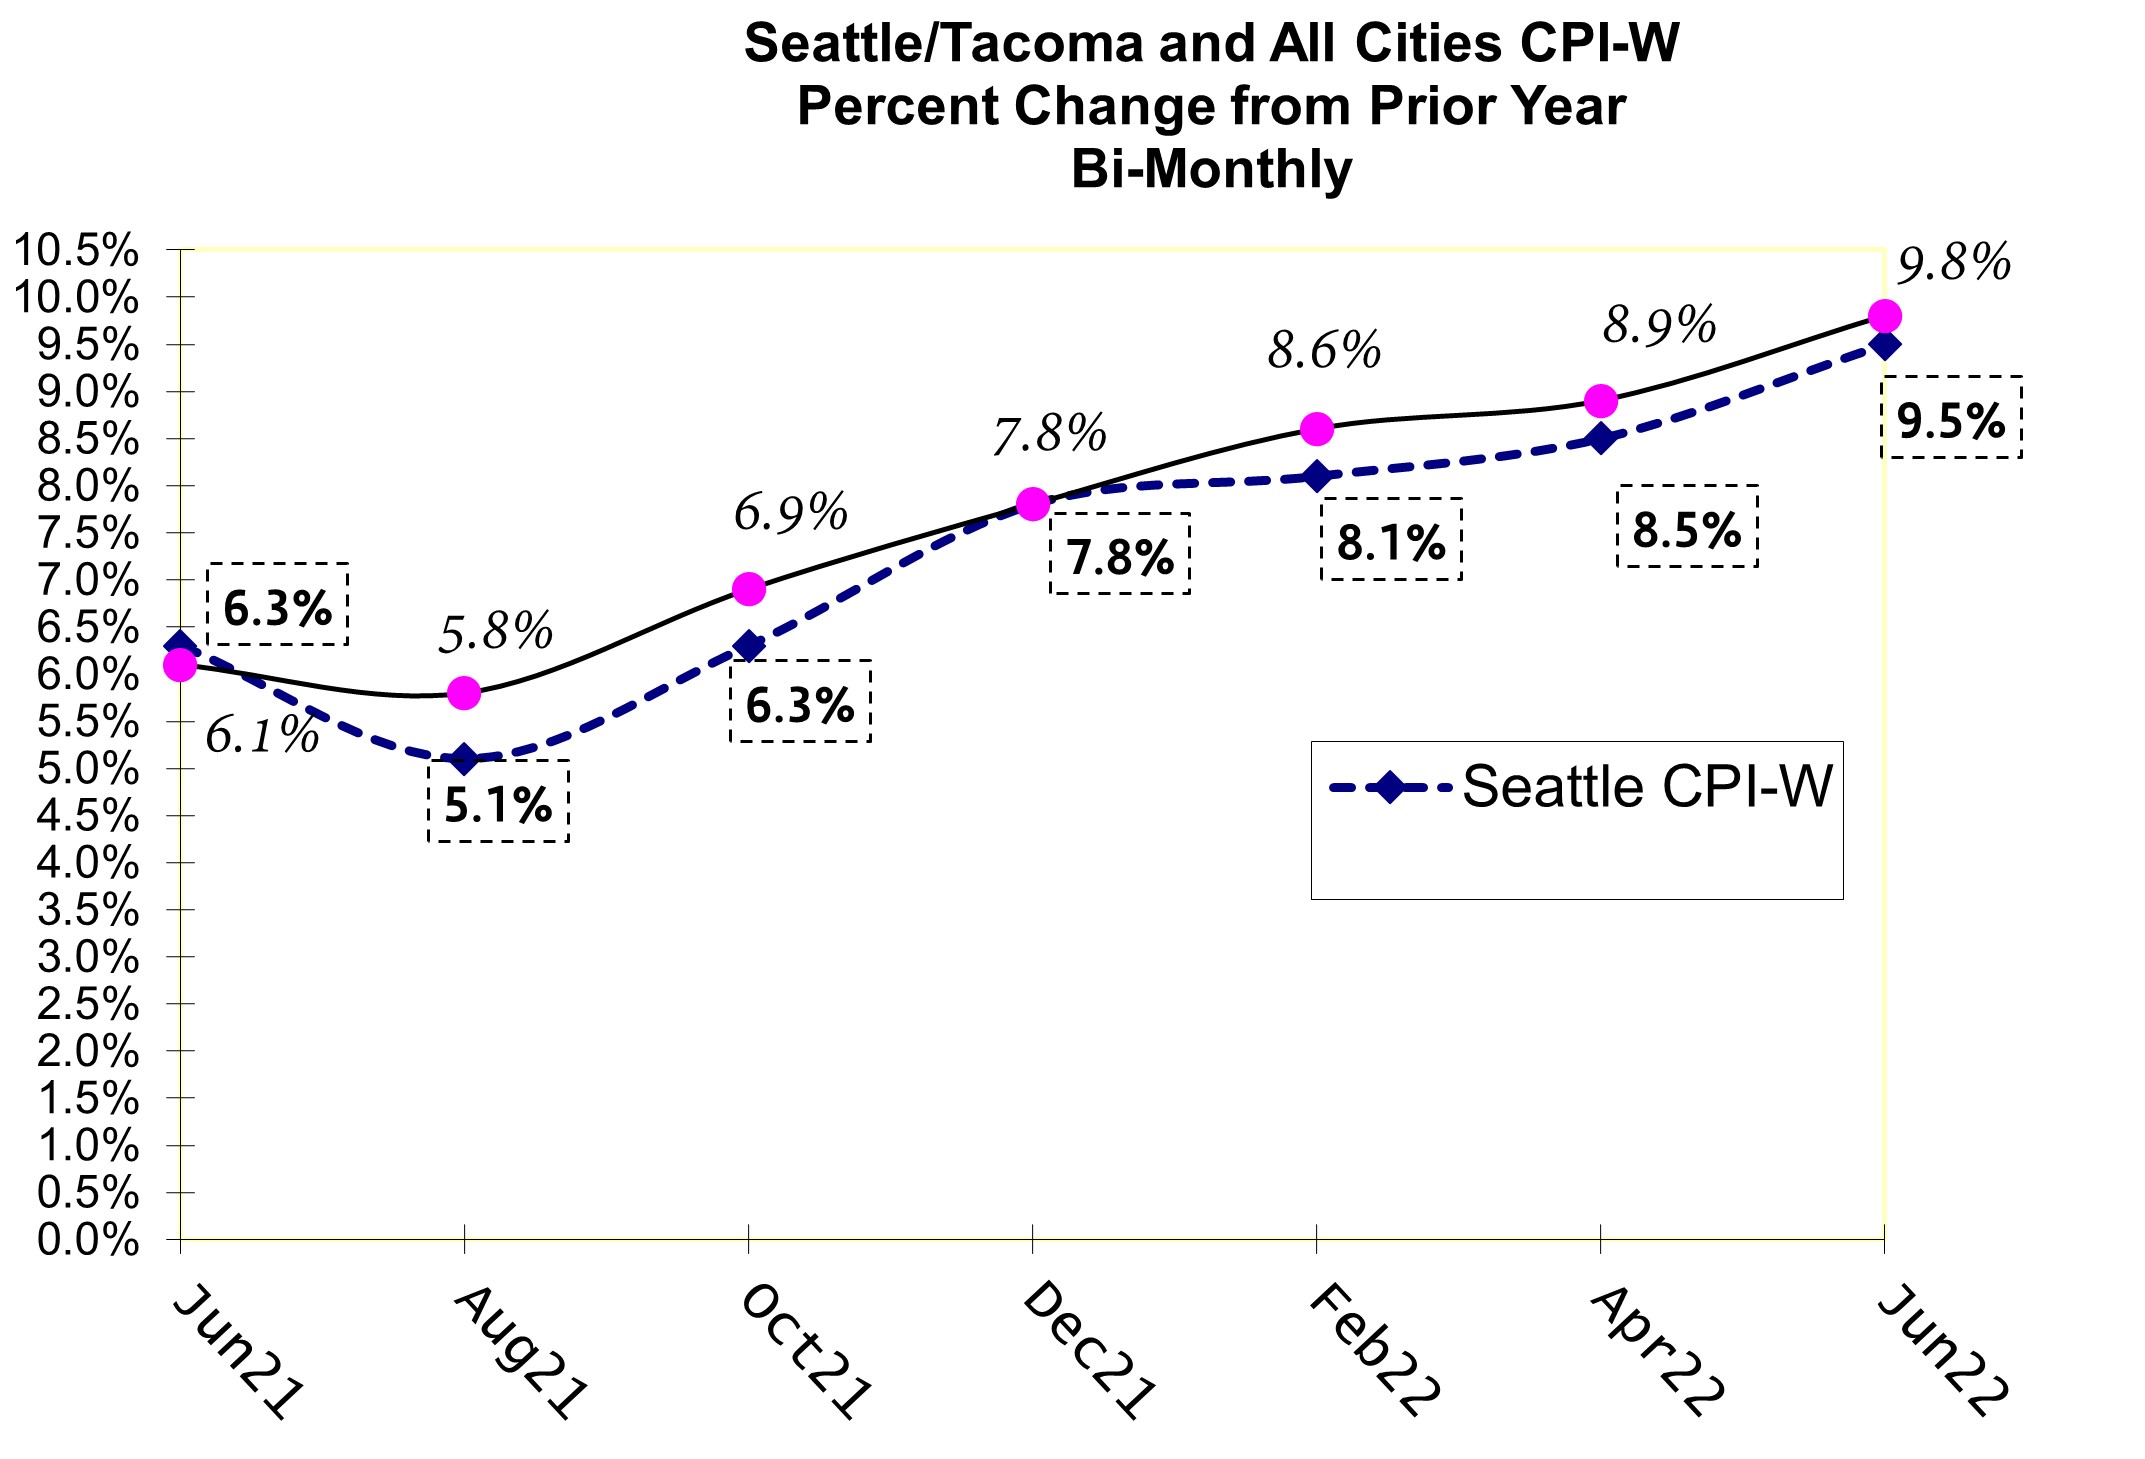
Those 9.5 and 9.8 percent numbers were unexpectedly high. We had been anticipating a bump in inflation, but not to that magnitude. Inflation has been advancing since the Spring of 2021, but few economists had been predicting numbers like these.
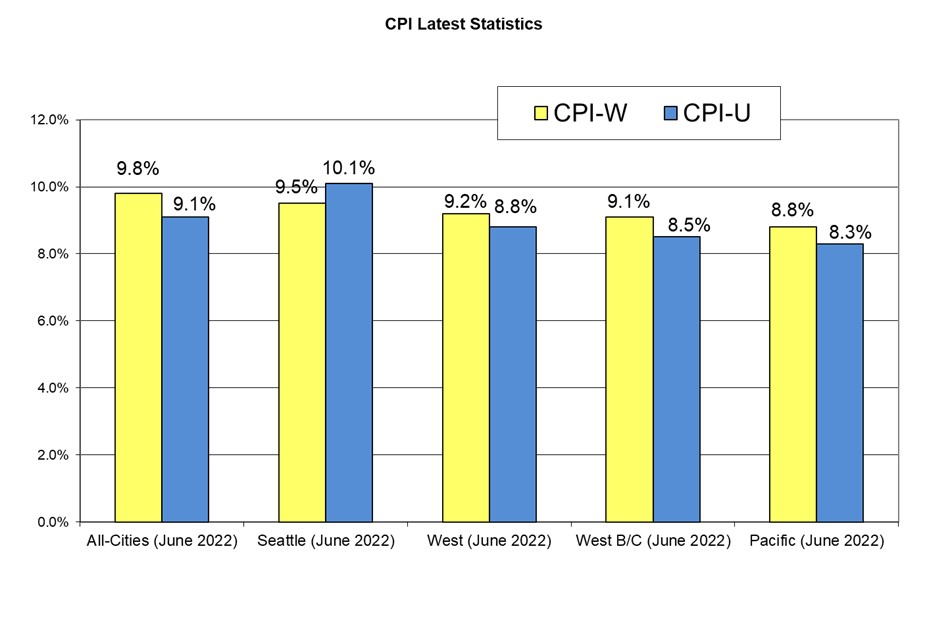
The below chart shows the June 2022 inflation rate on some other key indices used in Washington labor contracts:
As negotiations were proceeding in the months ahead of this report, it was apparent that inflation was rising. However, most predictions would have landed the number between six and seven percent. This means that in retrospect some of the previous settlements may not be as strong now as they appeared at the time. But it also means that for those entering negotiations for 2023 and beyond, many of the comparables settled for increases below full CPI.
More recently, in mid-August, the July numbers for the monthly All-Cities CPI and other monthly indices were released, showing a slight decline. This graph shows the July numbers compared to the June CPI-W numbers for the West coast and All Cities indexes that are reported monthly. All-Cities CPI has dropped below its 9.8% high to 9.1%, which is still extremely high:
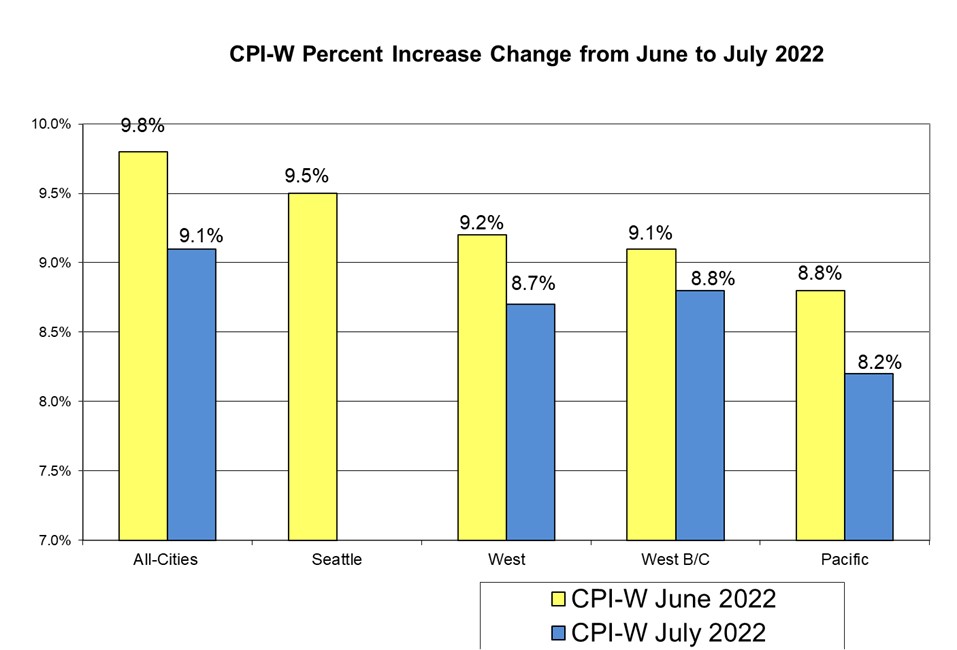
There is no Seattle number listed in this chart because the Seattle CPI index is released bimonthly so the next Seattle numbers will be for August and will be released in mid-September. For the monthly indexes, these lower July numbers were expected based on reports of costs of goods and services, especially the drop of energy prices. We’re also expecting a continued drop in inflation. In the next article in this series, we’ll discuss what professional economists are expecting inflation to do in the near to intermediate term.

