By Jim Cline and Kate Kremer

In the last issue we discussed whether – and to what extent — population influenced a jurisdiction’s relative wage ranking. In this article, we discussed to what extent assessed valuation influences that ranking.
In this article, we discuss wage as it relates to assessed valuation but for the detailed data, you’ll want to explore our Premium Website. If you’re not currently a Premium Website subscriber you can review our services Cline and Associates Premium Information Services and contact Carly Alcombrack at Cline and Associates and she’ll explain how you can become one: CAlcombrack@clinelawfirm.com.
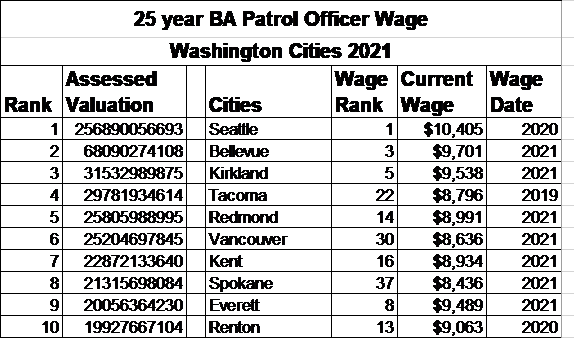
As we indicated previously, we have posted on our premium website detailed wage charts for the various public safety classifications (commissioned law enforcement, firefighter, corrections officer, dispatcher, and records clerks) which show state wage rankings and also the correlation of those wages to the factors we are discussing in this portion of our wage series — population, assessed valuation, and geographic location. In this article, we identify and discuss how assessed valuation correlates with the wage rankings for commissioned law enforcement personnel. (A more detailed chart of this commission data, along with the data for the other bargaining units is posted on the premium website 2021 Demographic Rankings. A review of assessed valuation data does indicate a strong correlation between assessed valuation and wage rank. As we move down the list the wage rankings also increase.
But despite the strong apparent correlation, the data does not explain all wage rankings. For example, Redmond has the 5th highest AV, yet its wage rank is 14, somewhat underwhelming for a King County agency. Spokane and Vancouver rank in the top ten but have a respective and surprising wage rank 37th and 30th. Tacoma has the 4th highest AV and its wage rank is 22nd. This may be in part due to its 2019 wage. On the other end of the AV spectrum, Olympia is 20th ranked for AV and has the 11th highest wage in the survey. Puyallup has a wage rank that far outperforms its assessed valuation — 28th in assessed valuation and 2nd in wages. So as we identified in the previous article on the series, there may be a lot of other variables at play affecting wage ranking and one should bear in mind that this wage ranking is based only on one piece of the total compensation covered by the CBA. Here is the top 10 list of city AV and wage rankings:
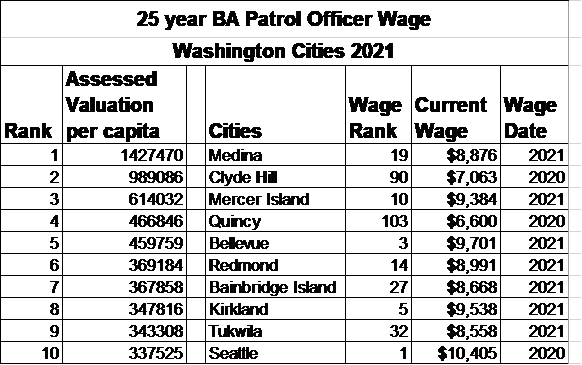
Putting the population and assessed valuation data together in the form of assessed valuation per capita is another strong predictor of wage rank and it can help in answering some of the anomalies in the other lists. For example, small Medina ranks 19th in the State in wages. Its population rank is 117 and assessed violation is the 33rd highest but its assessed valuation is at the top of the assessed valuation per capita. Local economic factors can affect these numbers. Quincy, home of numerous big tech data centers, has a small population relative to its assessed valuation and so its rank of 4th in AV per capita is out of line with its wage rank at 103rd. Below is the list of the top 10 Washington Cities AV Per Capita List.
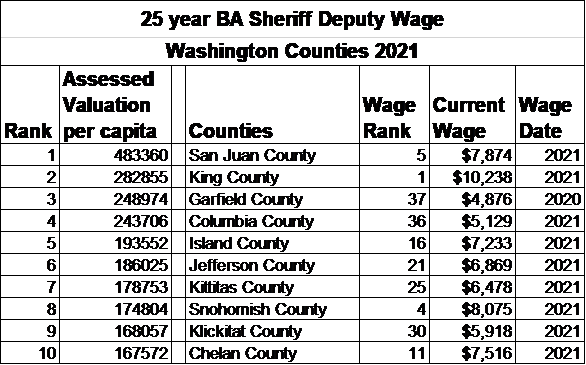
A review of County Deputy sheriff wages indicates a similarly strong correlation between County assessed valuation and County Deputy sheriff wages. While they do not match up exactly, as with most of these lists the higher wages tend to be at the top of this AV list and almost all of the AV ranks over 30 are ranked at the bottom of the wage list. It also reveals that several counties also “underperform” or “over perform” on wages relative to their assessed valuation. Spokane County is ranked 13th for its wage ranking which is low given its 5th AV. San Juan County is 21st ranked for AV but shows that strong 5th rank for wages at the 25-year BA level. Below is the list of the top 10 Washington counties ranked by Assessed Valuation.
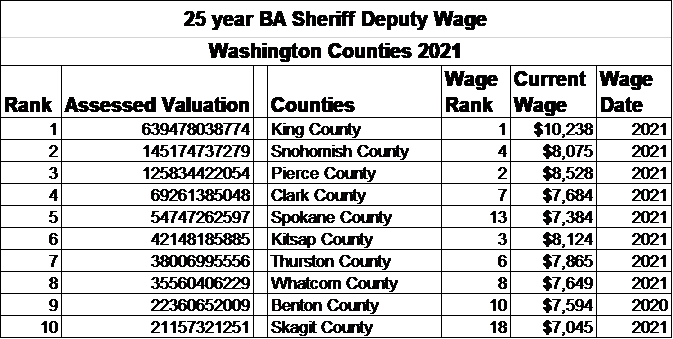
As with the Police Officers wages, the Assessed Valuation per capita ranking list can offer some insight into the anomalies in the deputy sheriff wage/demographic numbers. We make sense of San Juan County with its 7th rank for wages in spite of much lower ranking for population and assessed valuation because it is ranked first for AV per capita. Below is the AV per capita table for county deputy sheriffs.