By Jim Cline and Kate Kremer

In the last three parts of the wage series, we have discussed State wage rankings for the various public safety classifications. In the next part of the wage series, we run our series of articles on factors that might influence or explain, at least in part, those wage rankings, with updated 2019 wage rankings.
In this article, we discuss wage as it relates to population but for the detailed data, you’ll want to explore our Premium Website. If you’re not currently a Premium Website subscriber you can review our services Cline and Associates Premium Information Services and contact Carly Alcombrack at Cline and Associates and she’ll explain how you can become one: CAlcombrack@clinelawfirm.com.
In this article we discussed whether size — as measured by population — matters as to wage rankings and to what extent. In the next two articles we will discuss the influence of the two other variables most commonly used to predict comparability — assessed valuation and geographic location.
Along with the wage ranking data that we discussed previously in this series, our premium website has detailed charts 2021 Demographic Rankings which show the relative wage rank for some of the surveyed public safety classifications in each of the various cities and counties up against their wage rank in population and assessed valuation. In this article, we post a scaled-down version of those charts for two of the classifications — City Police and County Deputy Sheriffs. In these charts, we show the relative current wage rank for these bargaining units (the actual wage is posted on the premium website).
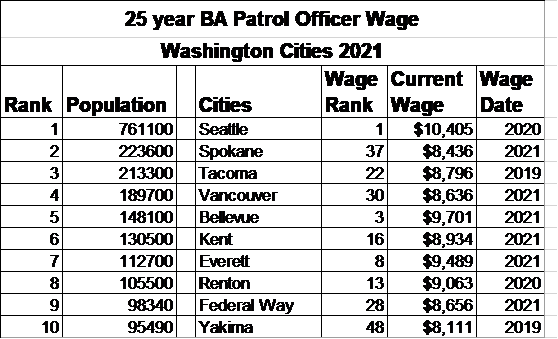
A review of this data indicates that size does, in fact, matter. The largest city, Seattle, predictably ranks number one and the smallest city of the 132 municipalities with police departments — Westport — ranks 112th. A review of the city wage charts — measuring the wage at the 25-year BA level — shows a strong correlation between population and wage ranking. Bellevue and Everett, for example, show a wage rank that correlates closely with their population.
What is actually perhaps more noteworthy about the chart, is the extent to which population does not always predict wage ranking. The chart reveals a number of police departments that are paid either high or low relative to their population.
Two of the factors besides population that explain bargaining units’ wages, are assessed valuation and location. If size explained all of the wage rankings, then you would not expect to see Spokane — the 2nd largest city in the state — with a wage ranked 37th. And Vancouver — the 4th largest city — is now ranked 30th, lagging despite its proximity to a large (Portland) metropolitan area.
Geographic location has a powerful relationship to wage position. Jurisdictions more proximate to Seattle and the Central Puget Sound labor market are often paid a significantly higher rate due to that location within the labor market. Typically, Eastern Washington jurisdictions are paid measurably less than Western Washington jurisdictions. And wages in King County are typically higher than wages and the rest of the State, as are wages in Pierce and Snohomish County. Some examples of this geographic impact are found in the Central Puget Sound cities of Olympia, 20th in population and 11th in wage rank, and small but affluent Mercer Island, 37th in population with the 10th highest Police Officer wage in the state.
And yet, this population-based wage chart reveals that this is not uniformly the case. For example, in Central Puget Sound, Lakewood is the 18th largest city and is ranked 47th. Clearly, more than population and geography are at play in determining wages. The top 10 Washington cities ranked by 2021 population are listed in the table below:
These charts only provide one snapshot view of the labor contract – the 25-year wage inclusive of longevity and education premiums. It does not account for other wage-related premiums that might be contained in the contract. This number also does not take into account that there may be other important elements of the contract that bargaining units gave up wages to retain — for example a good health insurance plan or reduced health insurance premium contributions. There may also be current economic and fiscal conditions in each of the cities that explain their wage status. So, this chart, while interesting, certainly does not tell the whole story.
Another possibility that no set of data analysis can fully explain is that some public safety unions, whether due to political influence, bargaining leverage, or simply skill and good preparation, are able to “punch over their weight” and land on what appear to be very strong contracts. That observation comes with the caveat that the entirety of the CBA, including other important pays and premiums, need to be considered alongside the base wage numbers.
A similar review of Deputy Sheriff wage data shows a strong correlation between size and wages along with some other unexpected results. King, Pierce, and Snohomish County rank 1, 2 and 4, corresponding closely to their population rank. King is first in population and wage. 4th largest Spokane drops to 13h. 5th largest Clark is 7th. Kitsap County seems to float near the top ahead of other western Washington like-sized agencies and even besting Snohomish County.
Here’s the Top 10 County chart for deputy sheriff population/wage ranking for counties:
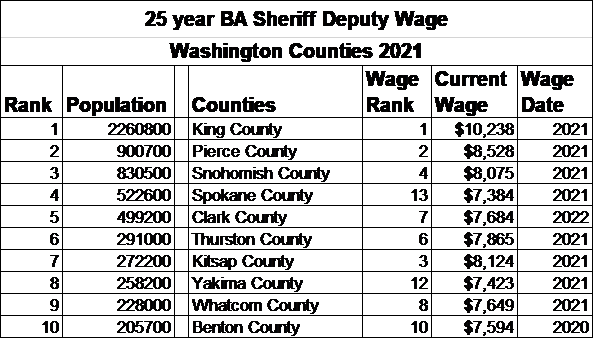
So, like Cities, Counties may “underperform” or “overperform” relative to their size.
Other variables like tax base and location often explain those results. And, as we indicated above, this wage ranking reports only one piece of the total compensation covered by the CBA (albeit an important one.)
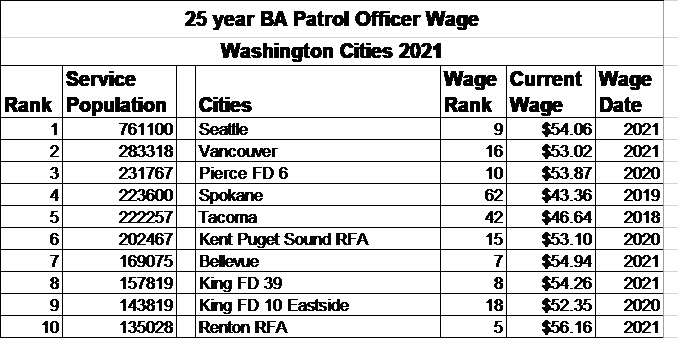
Fire districts and city fire departments often provide service to other departments and so the standard population statistics are not informative. Our office reviews the population statistics, the Fire District Tax Code Area Statements, and Fire Service Directory to compile population and assessed valuation service area demographics. These are used to select comparables for Firefighter Guilds.
In the next issue we’ll discuss how assessed valuation correlates to wages and after that we’ll discuss geographic location. We’ll learn that those factors do also strongly influence wage rankings. But you’ll eventually conclude that size, tax base and geography alone don’t explain those rankings and that other factors, perhaps local political and fiscal conditions or perhaps the relative success of bargaining units to negotiate for wages, also influence their rank.

