By Jim Cline and Kate Kremer
 In our July 24th blog article we reported on the June CPI and noted the wide spread between the “U” and “W” inflation indices and promised to provide an explanation as to the differences in these inflation measures. We cover that in today’s report.
As we noted there was a .5 spread in both the All-Cities U and W indices (0.1% v. -0.4) and the Seattle U and W (1.6% v. 1.1%). We indicated that by historic standards that was “surprising” given that “usually the differences between these measurements are small, often just .1 or .2.”
In fact, if you trace the historic numbers all the way back to 1960, even in periods of inflation much higher than current, you will find that there have been few occasions in which the these two measures CPI deviated more than .2%. Looking at the Seattle index [Seattle Annual CPI-W & U Difference , Seattle Annual CPI-W & U Table], for example, only in 19 of the past 55 years has the gap exceeded .2%. And in only 3 of those 55 years has the gap been as wide as or wider than reported in this June’s index. (The variability of the All-Cities numbers [All Cities Annual CPI-W & U Difference, All Cities Annual CPI-W & U Table] are similar.)
This graphs shows the year by year variation since 1960:
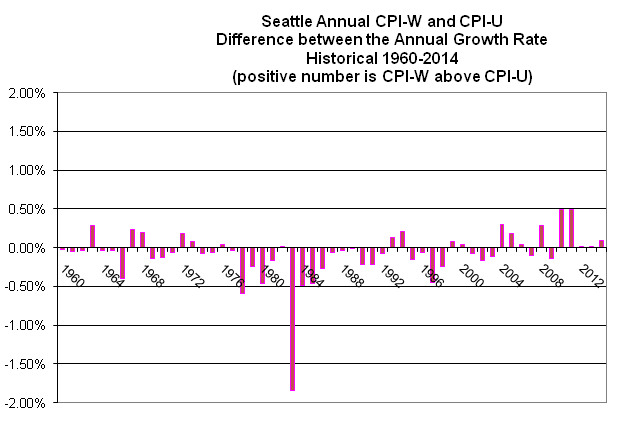
Table with data:
| Seattle CPI-U and CPI-W Annual Index and Growth Rates | |||
| Annual Seattle CPI W Growth Rate | Annual Seattle CPI U Growth Rate | Difference between W and U Growth Rate | |
| 1960 | 1.02% | 1.05% | -0.03% |
| 1961 | 1.69% | 1.74% | -0.05% |
| 1962 | 1.33% | 1.37% | -0.04% |
| 1963 | 1.97% | 1.68% | 0.28% |
| 1964 | 1.29% | 1.32% | -0.04% |
| 1965 | 1.27% | 1.31% | -0.04% |
| 1966 | 2.51% | 2.90% | -0.40% |
| 1967 | 3.06% | 2.82% | 0.24% |
| 1968 | 4.15% | 3.96% | 0.19% |
| 1969 | 4.84% | 4.99% | -0.14% |
| 1970 | 4.35% | 4.47% | -0.12% |
| 1971 | 2.08% | 2.14% | -0.06% |
| 1972 | 3.06% | 2.88% | 0.18% |
| 1973 | 6.44% | 6.36% | 0.07% |
| 1974 | 10.93% | 11.00% | -0.07% |
| 1975 | 10.06% | 10.13% | -0.07% |
| 1976 | 5.71% | 5.68% | 0.04% |
| 1977 | 7.93% | 7.96% | -0.04% |
| 1978 | 9.02% | 9.61% | -0.59% |
| 1979 | 10.87% | 11.11% | -0.24% |
| 1980 | 16.02% | 16.48% | -0.46% |
| 1981 | 10.83% | 11.00% | -0.17% |
| 1982 | 6.44% | 6.43% | 0.02% |
| 1983 | -0.20% | 1.64% | -1.84% |
| 1984 | 3.24% | 3.73% | -0.49% |
| 1985 | 2.06% | 2.52% | -0.47% |
| 1986 | 0.77% | 1.04% | -0.27% |
| 1987 | 2.29% | 2.34% | -0.06% |
| 1988 | 3.26% | 3.30% | -0.04% |
| 1989 | 4.69% | 4.70% | -0.01% |
| 1990 | 7.15% | 7.37% | -0.22% |
| 1991 | 5.55% | 5.76% | -0.21% |
| 1992 | 3.58% | 3.65% | -0.07% |
| 1993 | 2.94% | 2.81% | 0.14% |
| 1994 | 3.64% | 3.43% | 0.21% |
| 1995 | 2.89% | 3.04% | -0.15% |
| 1996 | 3.35% | 3.41% | -0.07% |
| 1997 | 3.05% | 3.49% | -0.45% |
| 1998 | 2.64% | 2.88% | -0.24% |
| 1999 | 3.13% | 3.04% | 0.08% |
| 2000 | 3.74% | 3.70% | 0.04% |
| 2001 | 3.55% | 3.63% | -0.08% |
| 2002 | 1.77% | 1.94% | -0.17% |
| 2003 | 1.47% | 1.58% | -0.12% |
| 2004 | 1.55% | 1.25% | 0.31% |
| 2005 | 3.01% | 2.82% | 0.18% |
| 2006 | 3.74% | 3.70% | 0.04% |
| 2007 | 3.78% | 3.88% | -0.10% |
| 2008 | 4.48% | 4.20% | 0.28% |
| 2009 | 0.44% | 0.58% | -0.14% |
| 2010 | 0.78% | 0.29% | 0.49% |
| 2011 | 3.17% | 2.68% | 0.49% |
| 2012 | 2.54% | 2.53% | 0.01% |
| 2013 | 1.22% | 1.22% | 0.00% |
| 2014 | 1.93% | 1.84% | 0.09% |
So given that this is a historic anomaly should you care whether you use the W or U index? We don’t think so. The more impactful issue, as we have noted several times in the past is whether you use the Seattle index rather than the All Cities index. As we have identified, the trend in those numbers over time have been significant and it can make an even larger difference in the current time where the strong Seattle regional economy is growing at a rate faster than the national, pushing up the local cost of living. The June report that showed a 1.5% difference in the Seattle and All-Cities indices is evidence of that.
As we previously explained in a 2012 blog:
As our long term readers are aware, we have recommended adopting the Seattle index over the National index. While there is an ebb and flow in the dueling sets of numbers, the Seattle index has historically outperformed the All-Cities index and we anticipate that trend will resume with a number of reports and indicators revealing that the Seattle economy will outgrow the national economy in the near term.
The benefit of the Seattle index could change over time but for many years now we have been advocating for use of the Seattle index, for those groups that tie their contract to a CPI index.
But we also recently discussed the possible benefits at the current time of foregoing a tie in to any particular CPI index, at least, in the near term. We identified the growing number of labor contracts that used a fixed percentage as opposed to a CPI formula. In fact, from 2006 to 2014 the percentage of contracts using a CPI formula dropped from 30% to 22%.
In our next article we’ll explain the difference in methodology for calculating the U and W CPI measures.
**Please visit our Premium Website for more information regarding current and past CPI reports.

